
Geoblink
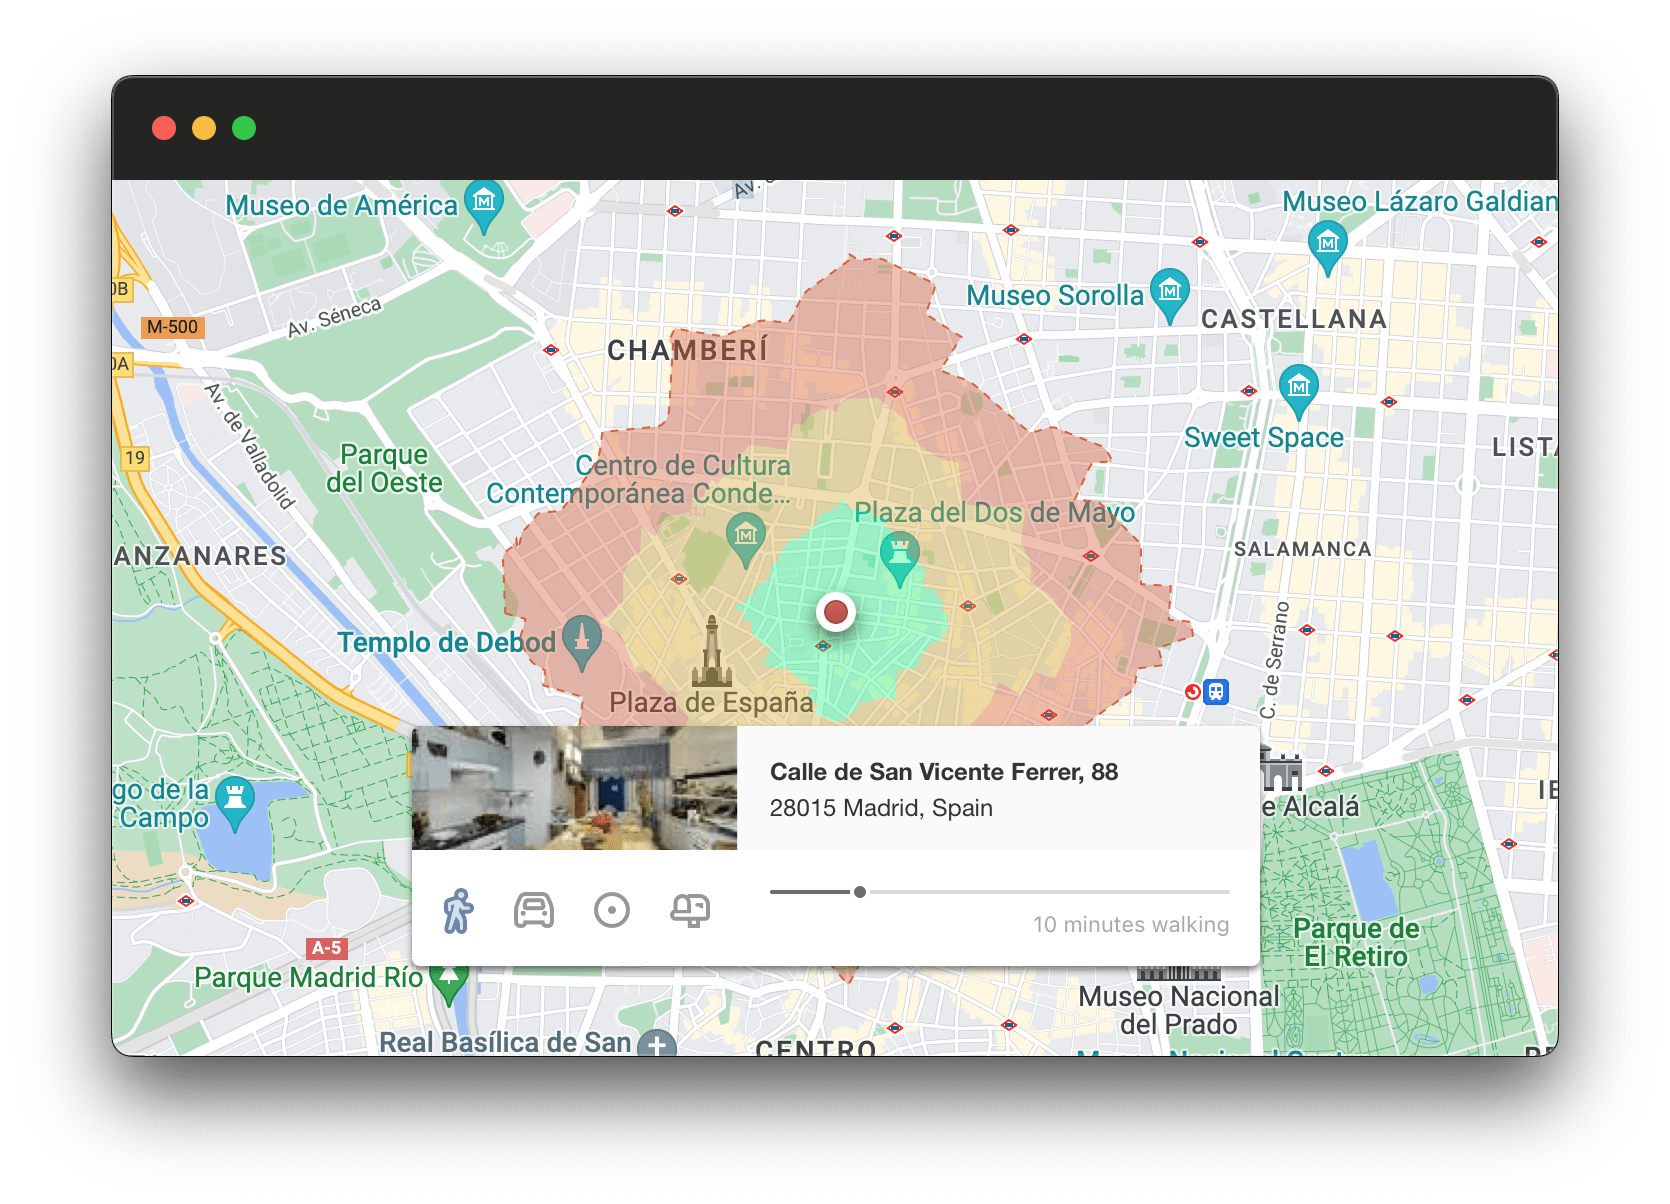
Geoblink is a Business Intelligence platform focused on the analysis of geographic data that allows different types of businesses to obtain relevant and accurate information on areas and population groups of interest. Its basic interface consists of a map similar to Google Maps on which certain operations can be performed (analysis of areas, information on points of interest...) and a side panel on which the report on the indicated area or the requested information is displayed.
Thus, one of the most common flows is to establish a catchment area, i.e. to define a space on the map on which the application will generate an automatic report.
During a period of approximately 3 months, the discovery of the problem and the implementation of the solution were carried out. The problem was identified through analysis of metrics and feedback from active users: the flow of catchment areas was complex, sub-optimal and incorporated more friction than would be desirable, which is particularly worrying for such a common flow.
Precedents
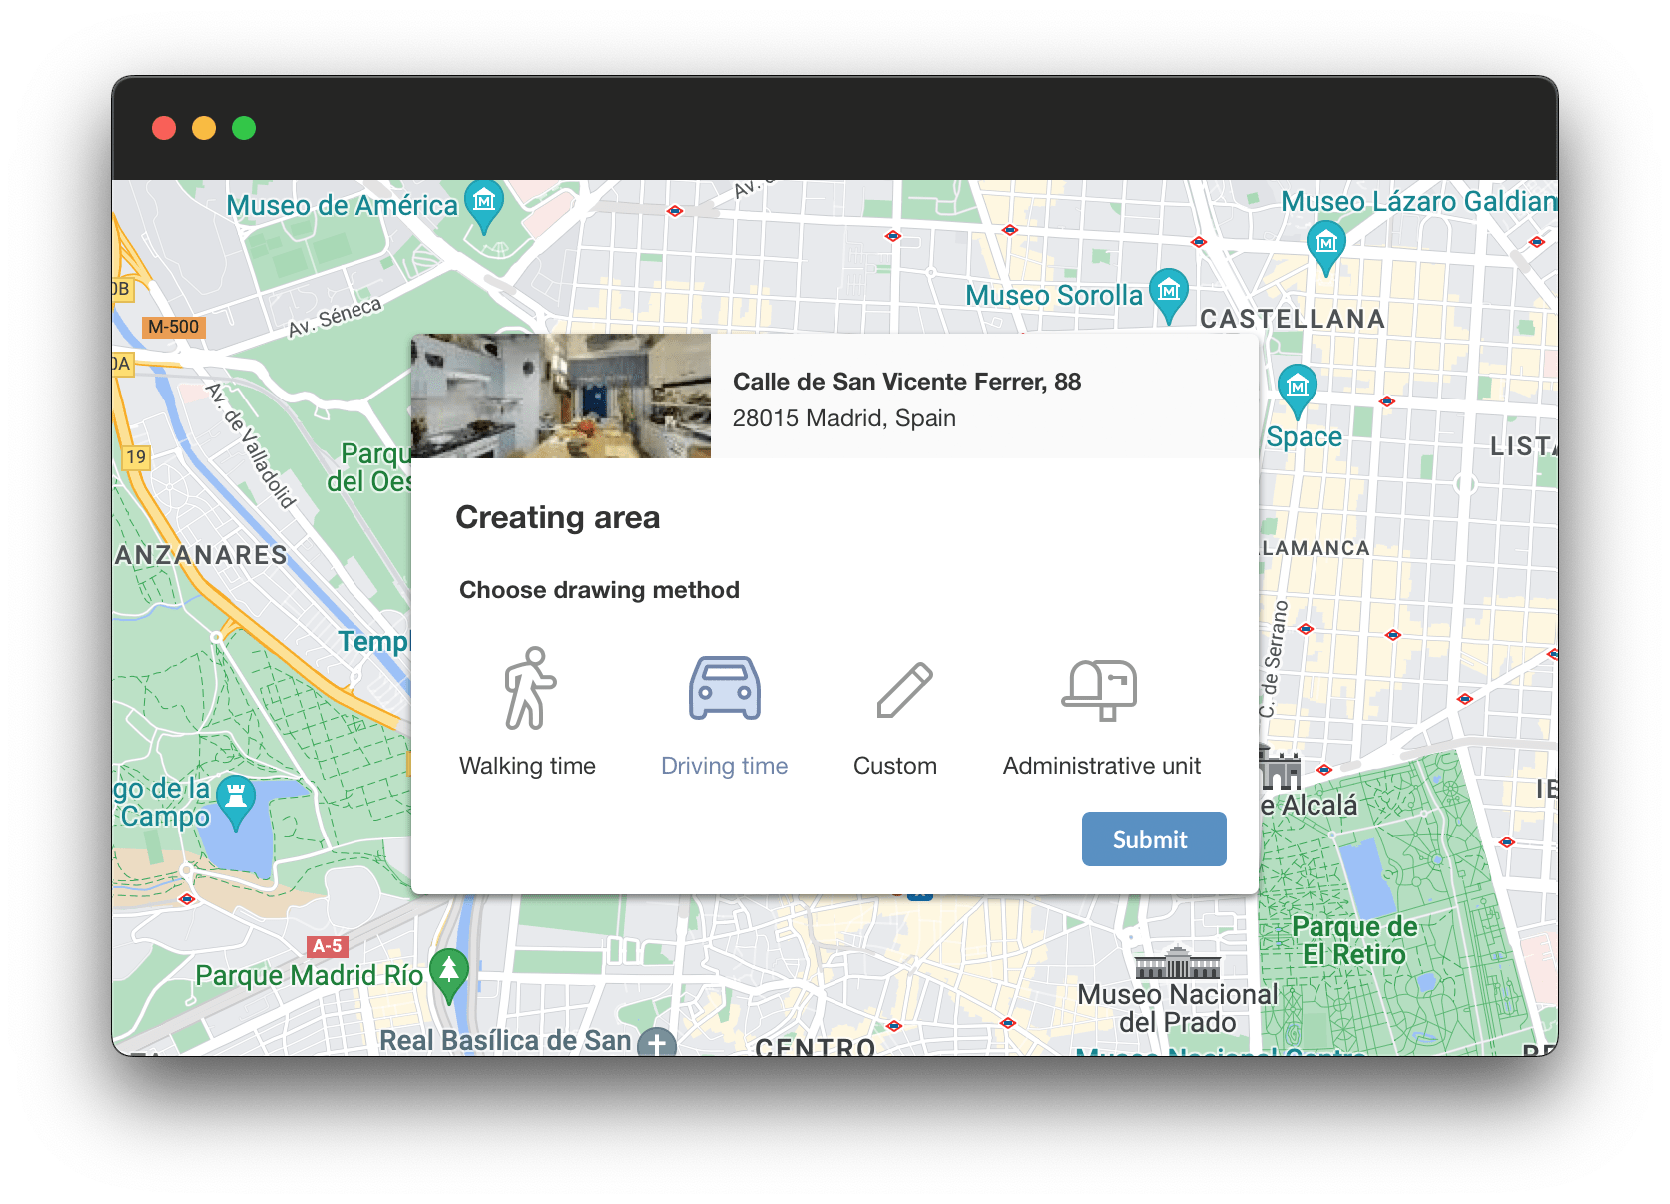
The original flow consisted of the following:
By walking or driving time

The user click on any point on the map, invoking the catchment area creation popup. They select the walking distance option, which takes them to the next stage of the popup, where they indicate in a text field the distance numerically and, finally, confirm the decision; this will display on screen the drawing of the area and the results of the report.
By free drawing
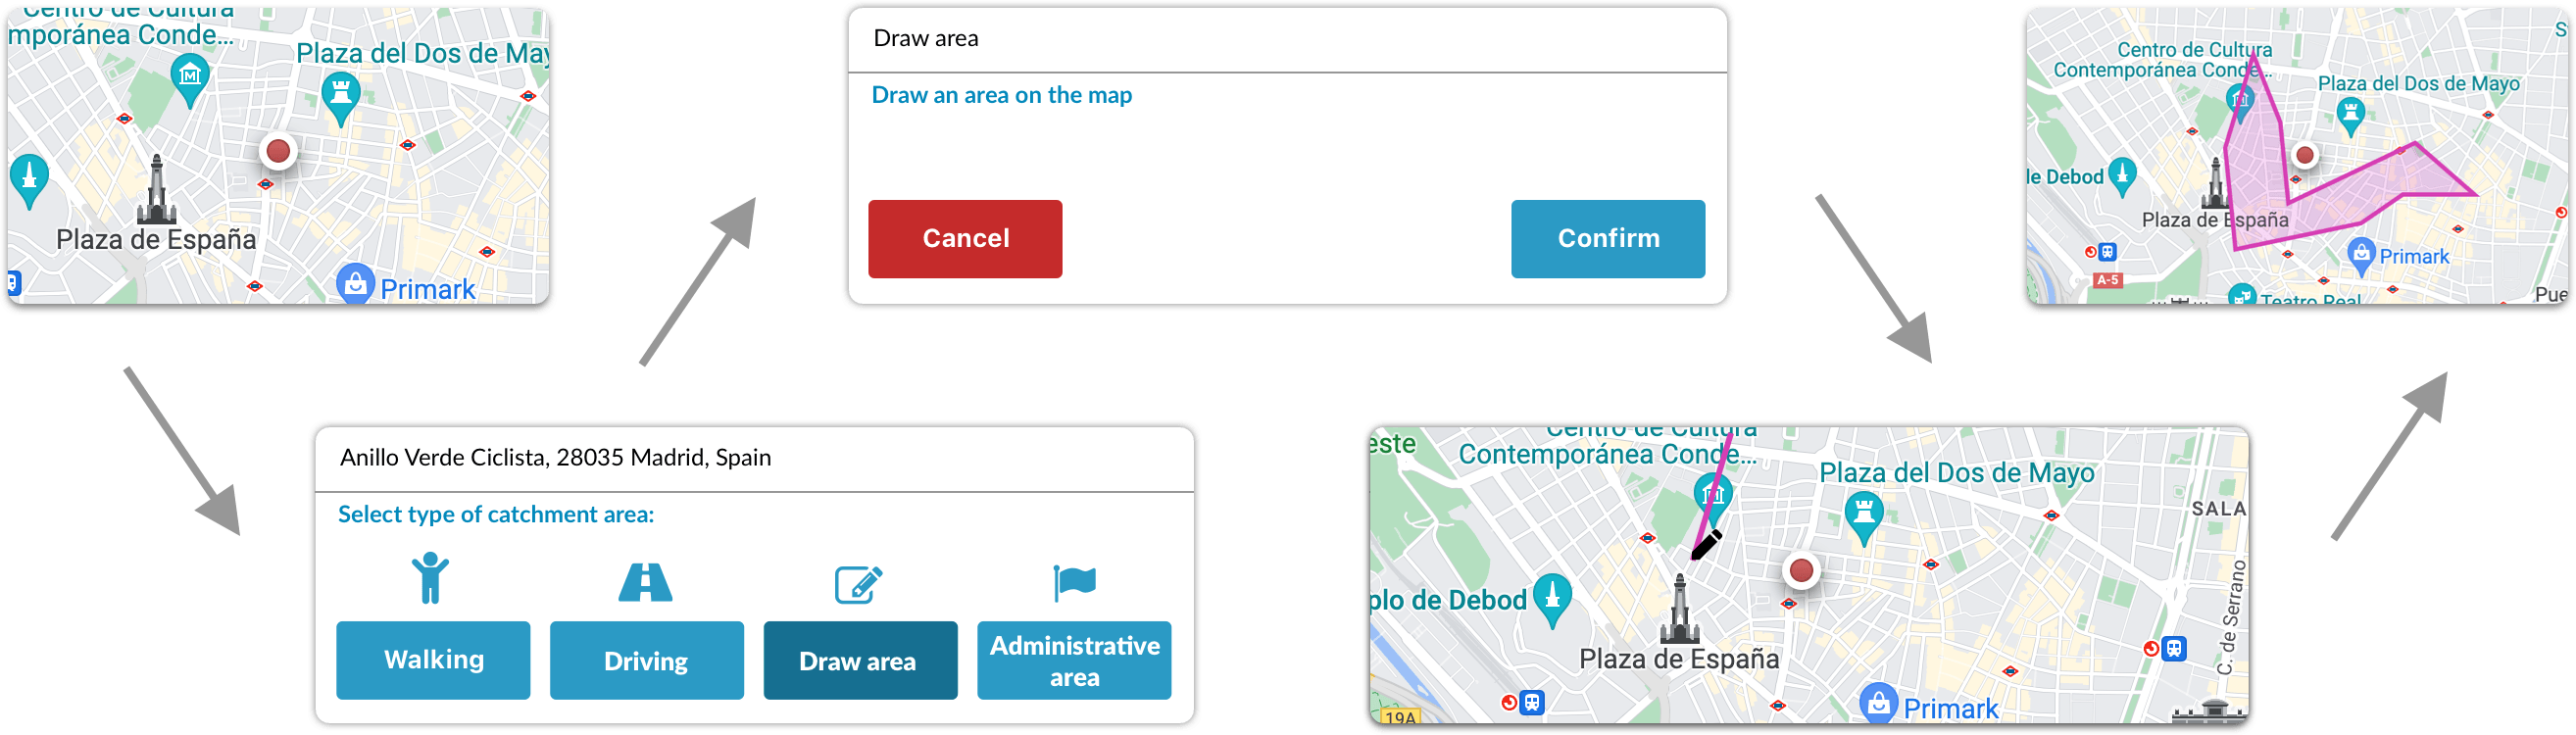
The users click on any point on the map, invoking the catchment area creation popup. They select the draw area option and then proceed to draw an arbitrary area on the map (which may or may not contain the chosen starting point) by the procedure of clicking on the vertices of the polygon they want to draw and finally, confirm the decision; which will display on screen the area drawing and the results of the report.
By administrative area/unit
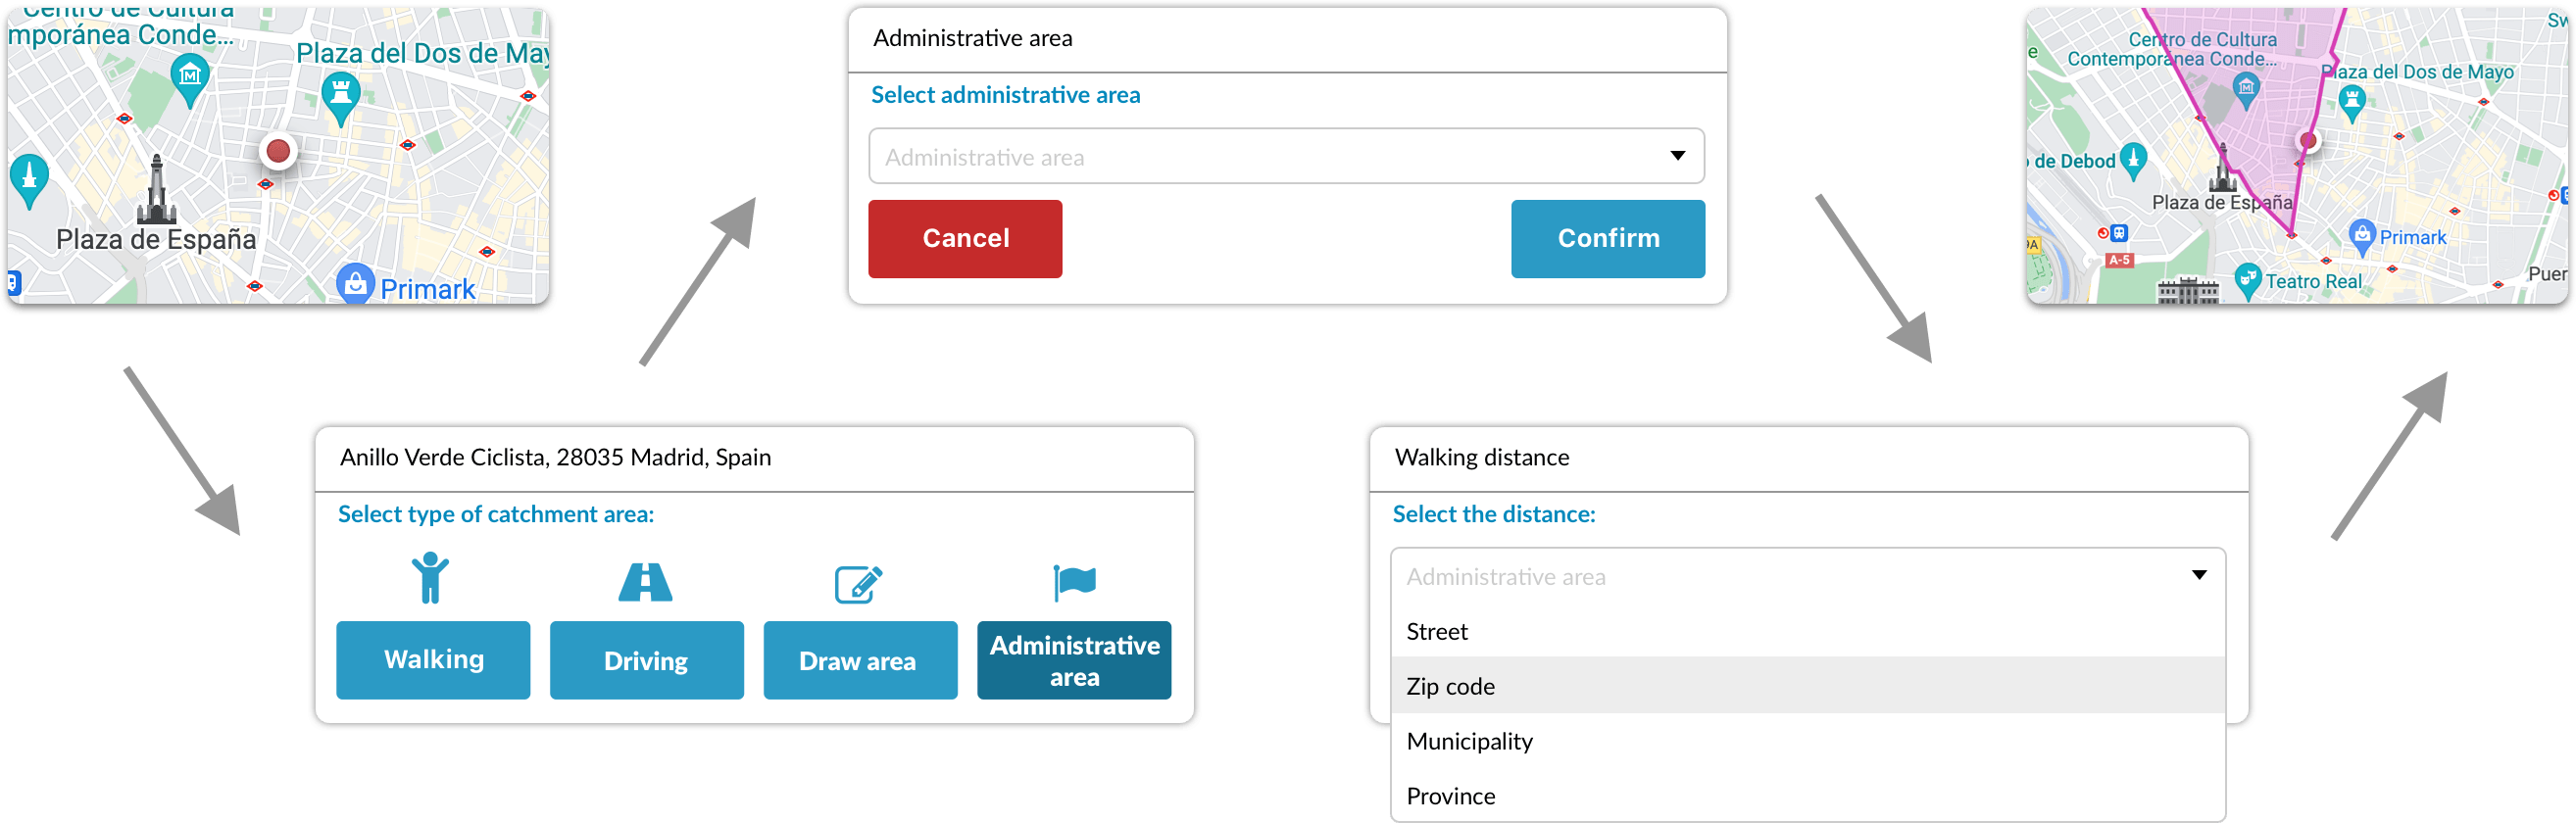
The users clicks on any point on the map, invoking the catchment area creation popup. They select the administrative area option, which takes them to the next stage of the popup, where they select in a dropdown the size of the desired administrative area (road, postcode, municipality or province) and, finally, confirms the decision; this will show on screen the drawing of the area and the results of the report.
Research
Scope and goals
Thanks to our metrics feed we knew that one of the most frequent user flows in our product was the creation of catchment areas, in particular the creation of "10 minutes radius" walking catchment areas, i.e; our users wanted to know in most cases exactly what area could be covered by a pedestrian walking 10 minutes starting from a specific point, which is explained, above all, because 10 minutes walking is a comfortable walk that people usually have no problem in carrying out when going shopping or just leaving home in a Spanish city, in which, in general, the city centre is designed for pedestrian traffic.
With this information, our purpose was to find out how we could make one of the flows most valued by our customers even more comfortable, agile, functional and better. To achieve this, we asked ourselves the following questions:
What is the purpose of creating catchment areas?
What information is most relevant when creating a catchment area?
Do users understand how to effectively create catchment areas?
Do users know how to interpret the information resulting from a catchment area?
Methodology
To find answers to these questions, we focused on three methodologies: market research to find out about other solutions to similar problems, generalised surveys to our user base and three face-to-face usability sessions with some of our customers both satisfied with the product and with suggestions or criticisms in order to reduce biases in our analysis.
Insights
The most common catchment area is "the 10-minute walk" one, just behind it are other walking areas with different time radius. The areas with a time radius by personal vehicle are less frequent but also present. The main reason for this is that customers want to get to know areas that a pedestrian can walk to on a typical walk or a short and comfortable car journey.
Several users have stopped using the functionality because they found it complex, others because they did not understand its usefulness, and others have never used it at all. Despite this, the users who do use it do so very frequently.
The lack of current information and feedback means that many users are unsure of exactly what information they are getting when creating an catchment area or reporting on it.
Most users find the flow slow and repetitive and would like it to be more streamlined and user-friendly.
Ideation
From this information, we started working with two clear intentions: to transform the functionality of the tool to make it as simple, efficient and user-friendly as possible and to use this redesign to take the first step in building Geoblink's new and coherent design language.
So, we sketched out different options on how to eliminate unnecessary clicks, provide instant feedback and use the different UI elements in a way that made the flow as clear and unambiguous as possible.
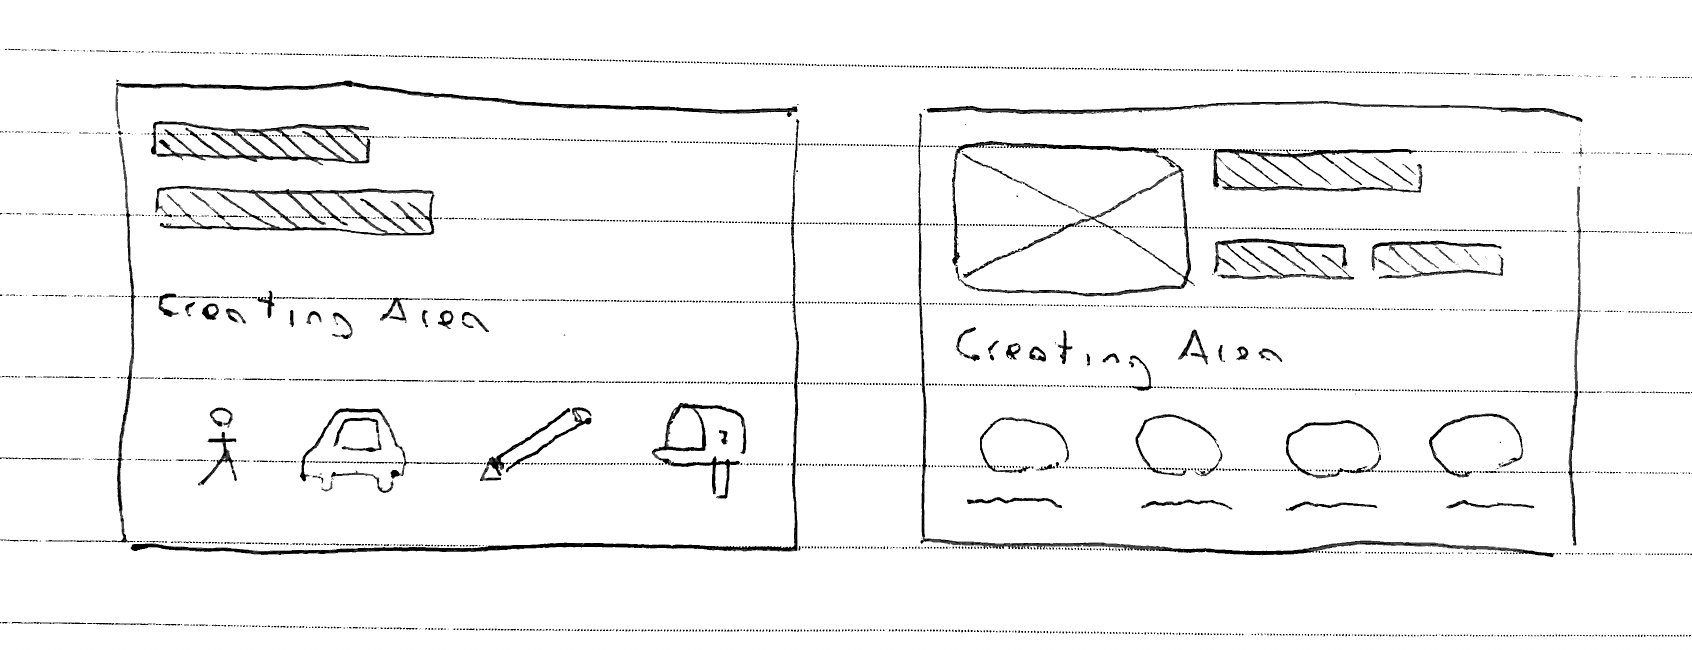
One of the first explorations was the replacement of the old icons (generic, from an icon bank) by own icons designed specifically for the functionality and respecting the guidelines of the new style guide.
We carried out several iterations, after which we observed, among other things, that it was difficult to justify the "paint area" option in a popup that appears when clicking on a specific address, so this option was moved to another section of the platform where its presence was organic and predictable.
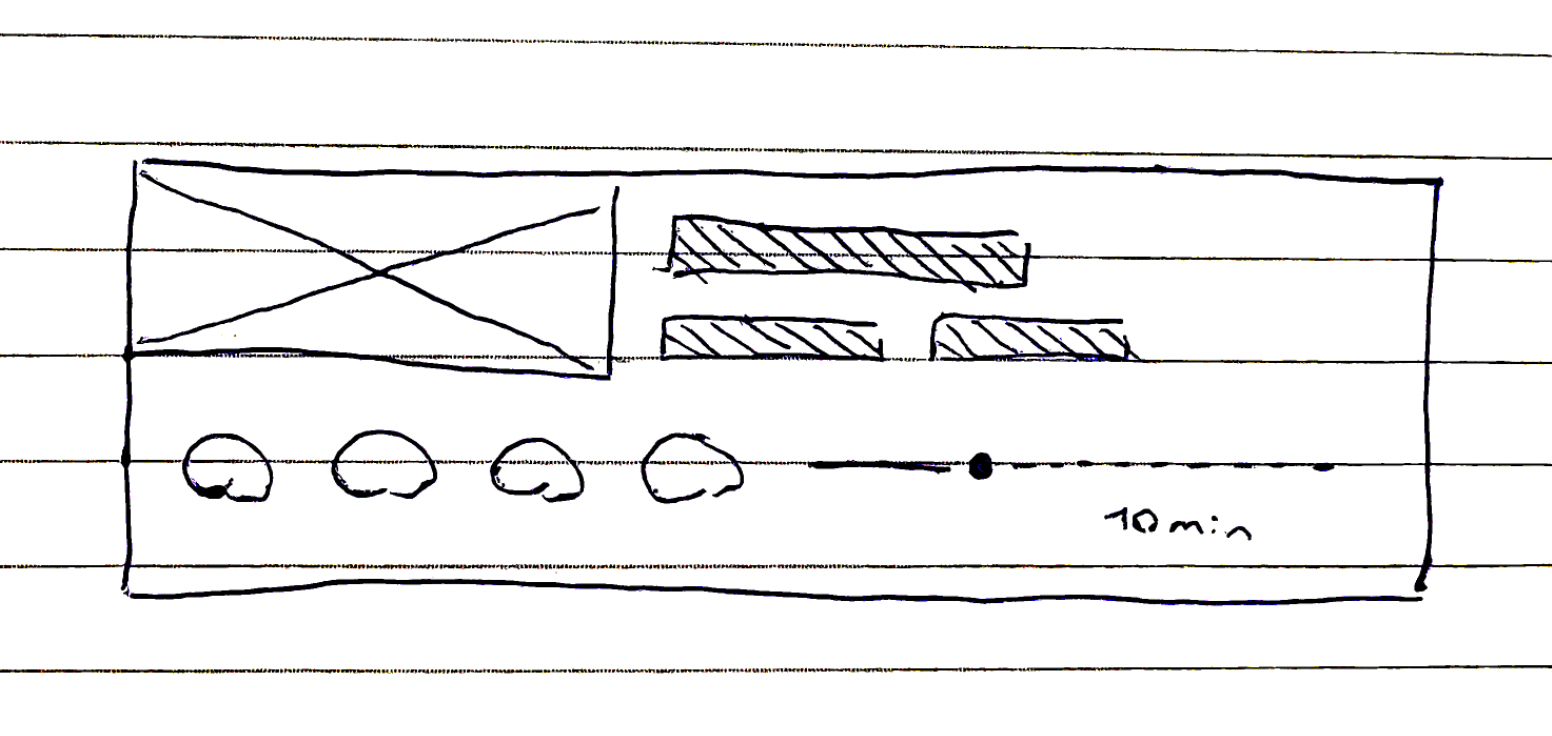
Finally, taking into account the results of both usage metrics and user research, we decided to reduce friction as much as possible by combining two principles: reducing friction (eliminating unnecessary steps and using default states that correspond to the parameters most used by users) and improving communication (providing real-time feedback from the first click).
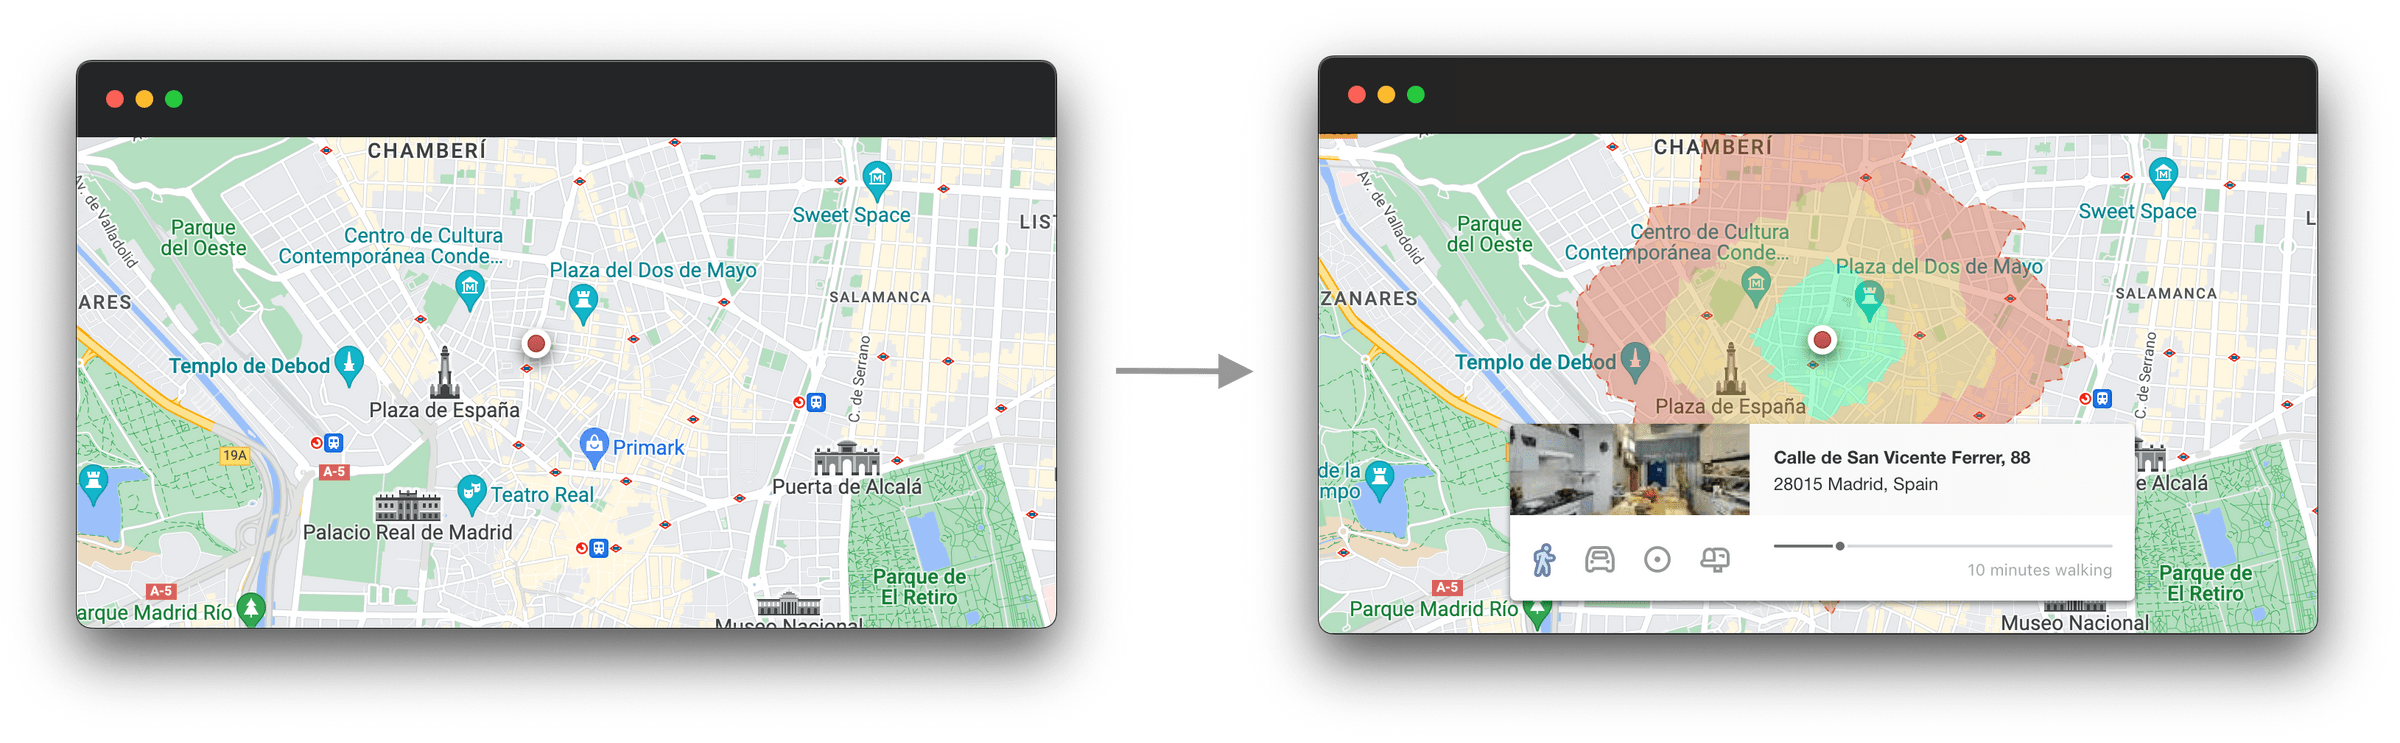
Finally, the proposed redesign had reduced friction significantly; from 3 clicks and several keystrokes for the creation of the most common catchment area (10 minute walk) to 1 click and no keystrokes.
In addition, the new icons were better able to communicate their function and the new interface with one less step and immediate feedback resulted in a much more effective simplification and clarification of the usefulness of the functionality.
Gathering feedback
Prototype
Our methodology was always to work as close to the client as possible, so sketches were converted to high fidelity at an early stage and tested with the client on several occasions both in person and in an asynchronous and simplified way: the results were extremely satisfactory.
Testing
The testing of the redesign was carried out in two ways, with surveys on very specific aspects (clearness of icons, clarity, speed...) and with usability sessions on the prototype, observing and analysing the different flows of creation of catchment areas.
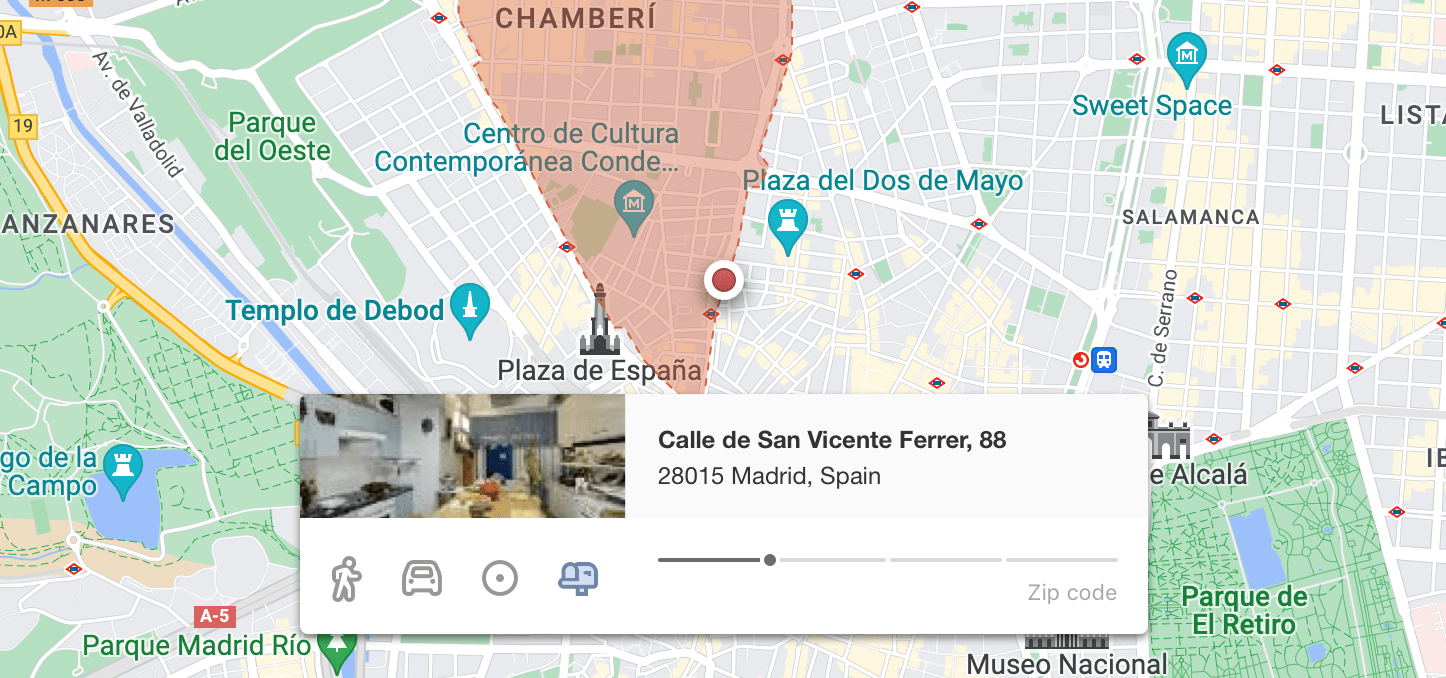
Users were instrumental in helping us come up with the perfect iconography: the conclusion was that the best icons for each of the area creation criteria would be a pedestrian for "walking distance", a car for "driving distance", a circumference with a visual centre for "radial area" and a typical mailbox for "administrative area", as opposed to the old pedestrian, road, pencil and flag.

On the other hand, we polished the experience in the last case (administrative term) so that the slider was discrete in terms of visual feedback, which better clarified that each possible area to be drawn was a concrete one taking into account the defined criteria.
As for the rest of the changes introduced, the reception was unanimously positive and even way above expectations for some!
Results
Final solution
The final proposal consisted of a visual and functional redesign of the functionality of creating catchment areas with the clear intention of transforming the experience into something predictable, practical and pleasurable.

The new user flow made use of the default states as soon as they were invoked to reduce friction, a goal that was achieved in most cases, as the popup's default state was precisely the most frequently consulted catchment area.


The fact that the feedback was immediate (0 seconds in the drawing of the area and two seconds of delay in the elaboration of the report) meant that each function of each phase in the flow was absolutely clear and the feeling of control over the platform was total.
In addition, as an extra tool to help the user, a tutorial of the new flow was available, which would be shown the first time the user displayed the new popup with clarifications such as the meaning of the new colours in the catchment area.
Result
The result of this project was evident from day one. Not only did many customers expressly thank us for the redesign, but the metrics started to show a substantial increase in the creation of catchment areas, as well as in the average session duration or, most positively: the fact that users who had not used the feature at all or hardly used it up to now started to use it regularly!
"With Geoblink people are more comfortable with the database we have and are self-sufficient."
Daniel Izquierdo - Business Intelligence Analyst - Danone
"Now every time we are going to make a new opening, we bring a Geoblink report."
Andreu Beltran - Marketing Communication Manager - Granier
Ultimately, the user experience was measurably improved, the challenge was successfully solved and the solutions made the product more useful than ever to customers, with the months of work considered a personal and product team victory.
Plans for the future
The redesign and development of this functionality was not only a huge success with users, but also served as a gateway for several of the projects we would be working on in the coming months.
One example is the Geoblink icon set, a fun and challenging project consisting of replacing all the platform's icons, which were generic and sometimes inaccurate, with icons made specifically for the platform, with their own identity and respecting the new style guides.
Although the biggest impact of this redesign was, without a doubt, to establish the basis for the redesign of the entire frontend of the platform following the same principles of reducing friction to the maximum and optimising communication; which finally allowed us to build a coherent, cohesive and functional design system that, after more than a year of work, we managed to release in the form of open source code:

All in all, the redesign of the catchment area creation panel not only had a considerable intrinsic impact, but also contributed directly to the improvement of the whole product in the medium term.
Even so, Geoblink will always put the customer first and react as quickly as possible to any need, new or old, that may come to the team's attention! Time will surely bring new challenges and new opportunities.