
Visual

Visual is a platform for integrated farm management, this covers everything from staffing to maintenance and care of crops from both PC (webapp) and smartphone (both iOS and Android with the respective native apps).
Thanks to feedback from several users, we discovered that it was necessary to create a screen that quickly and visually showed a summary of the situation of a specific plot and concluded whether the conditions were suitable for applying a certain treatment (pesticides, fertilisers...) or not.
Over a period of about 45 days, I faced the challenge of collecting the necessary feedback, prototyping and evaluating the new feature and thus completing the design of the crop status view function.
Precedents
Several customers had told us of their concerns when applying treatments to crops, as atmospheric conditions such as temperature, rainfall or wind can partially or even totally nullify their effect or even cause a reaction contrary to the expected one.
Given this, we concluded that Visual could offer a solution that was as clear and simple as possible for the user, so we began to investigate possible proposals.
Research
Scope and goals
Initially, our aim was to come up with a proposal that would allow the user (manager, grower or crop worker) to easily know whether it is the right time or not to apply treatments to the field.
In order to advance the research, we asked the following questions.
What is the real need of the user?
What kind of information is relevant to them?
Where is the best place to provide this information?
Methodology
To answer these questions, we conducted several usability sessions with clients of different types and extent of crops in order to come up with a solution that was as comprehensive and effective as possible.
Insights
The users' need is to know whether or not it is a good time to apply a certain treatment to a crop and why.
The users want to know quickly whether or not it is the right time to apply the treatment, but since each treatment has specific contraindications, they also want to know the real reason for the recommendation.
Since weather conditions are constantly changing, the ideal place to locate the feature is the mobile application, as the farm manager decides each day, based on the information provided, whether or not to carry out the treatment.
Ideation
With the above information, we began to consider possibilities. Ideally, our aim was to provide an optimal solution to the problem of ignorance about the appropriateness of treatment delivery; this implies clarity, simplicity, relevance and as little friction as possible.
With this in mind, we evaluated several proposals, some simpler and some more verbose, with the intention of evaluating them with real users at a later stage.

The simplest proposal was a view that informs in natural language whether or not it is the right time to apply the phytosanitary treatment in question.
Another possibility was an evolution of the previous one, in which, in addition to informing about the suitability of the application, the reason was also indicated visually.
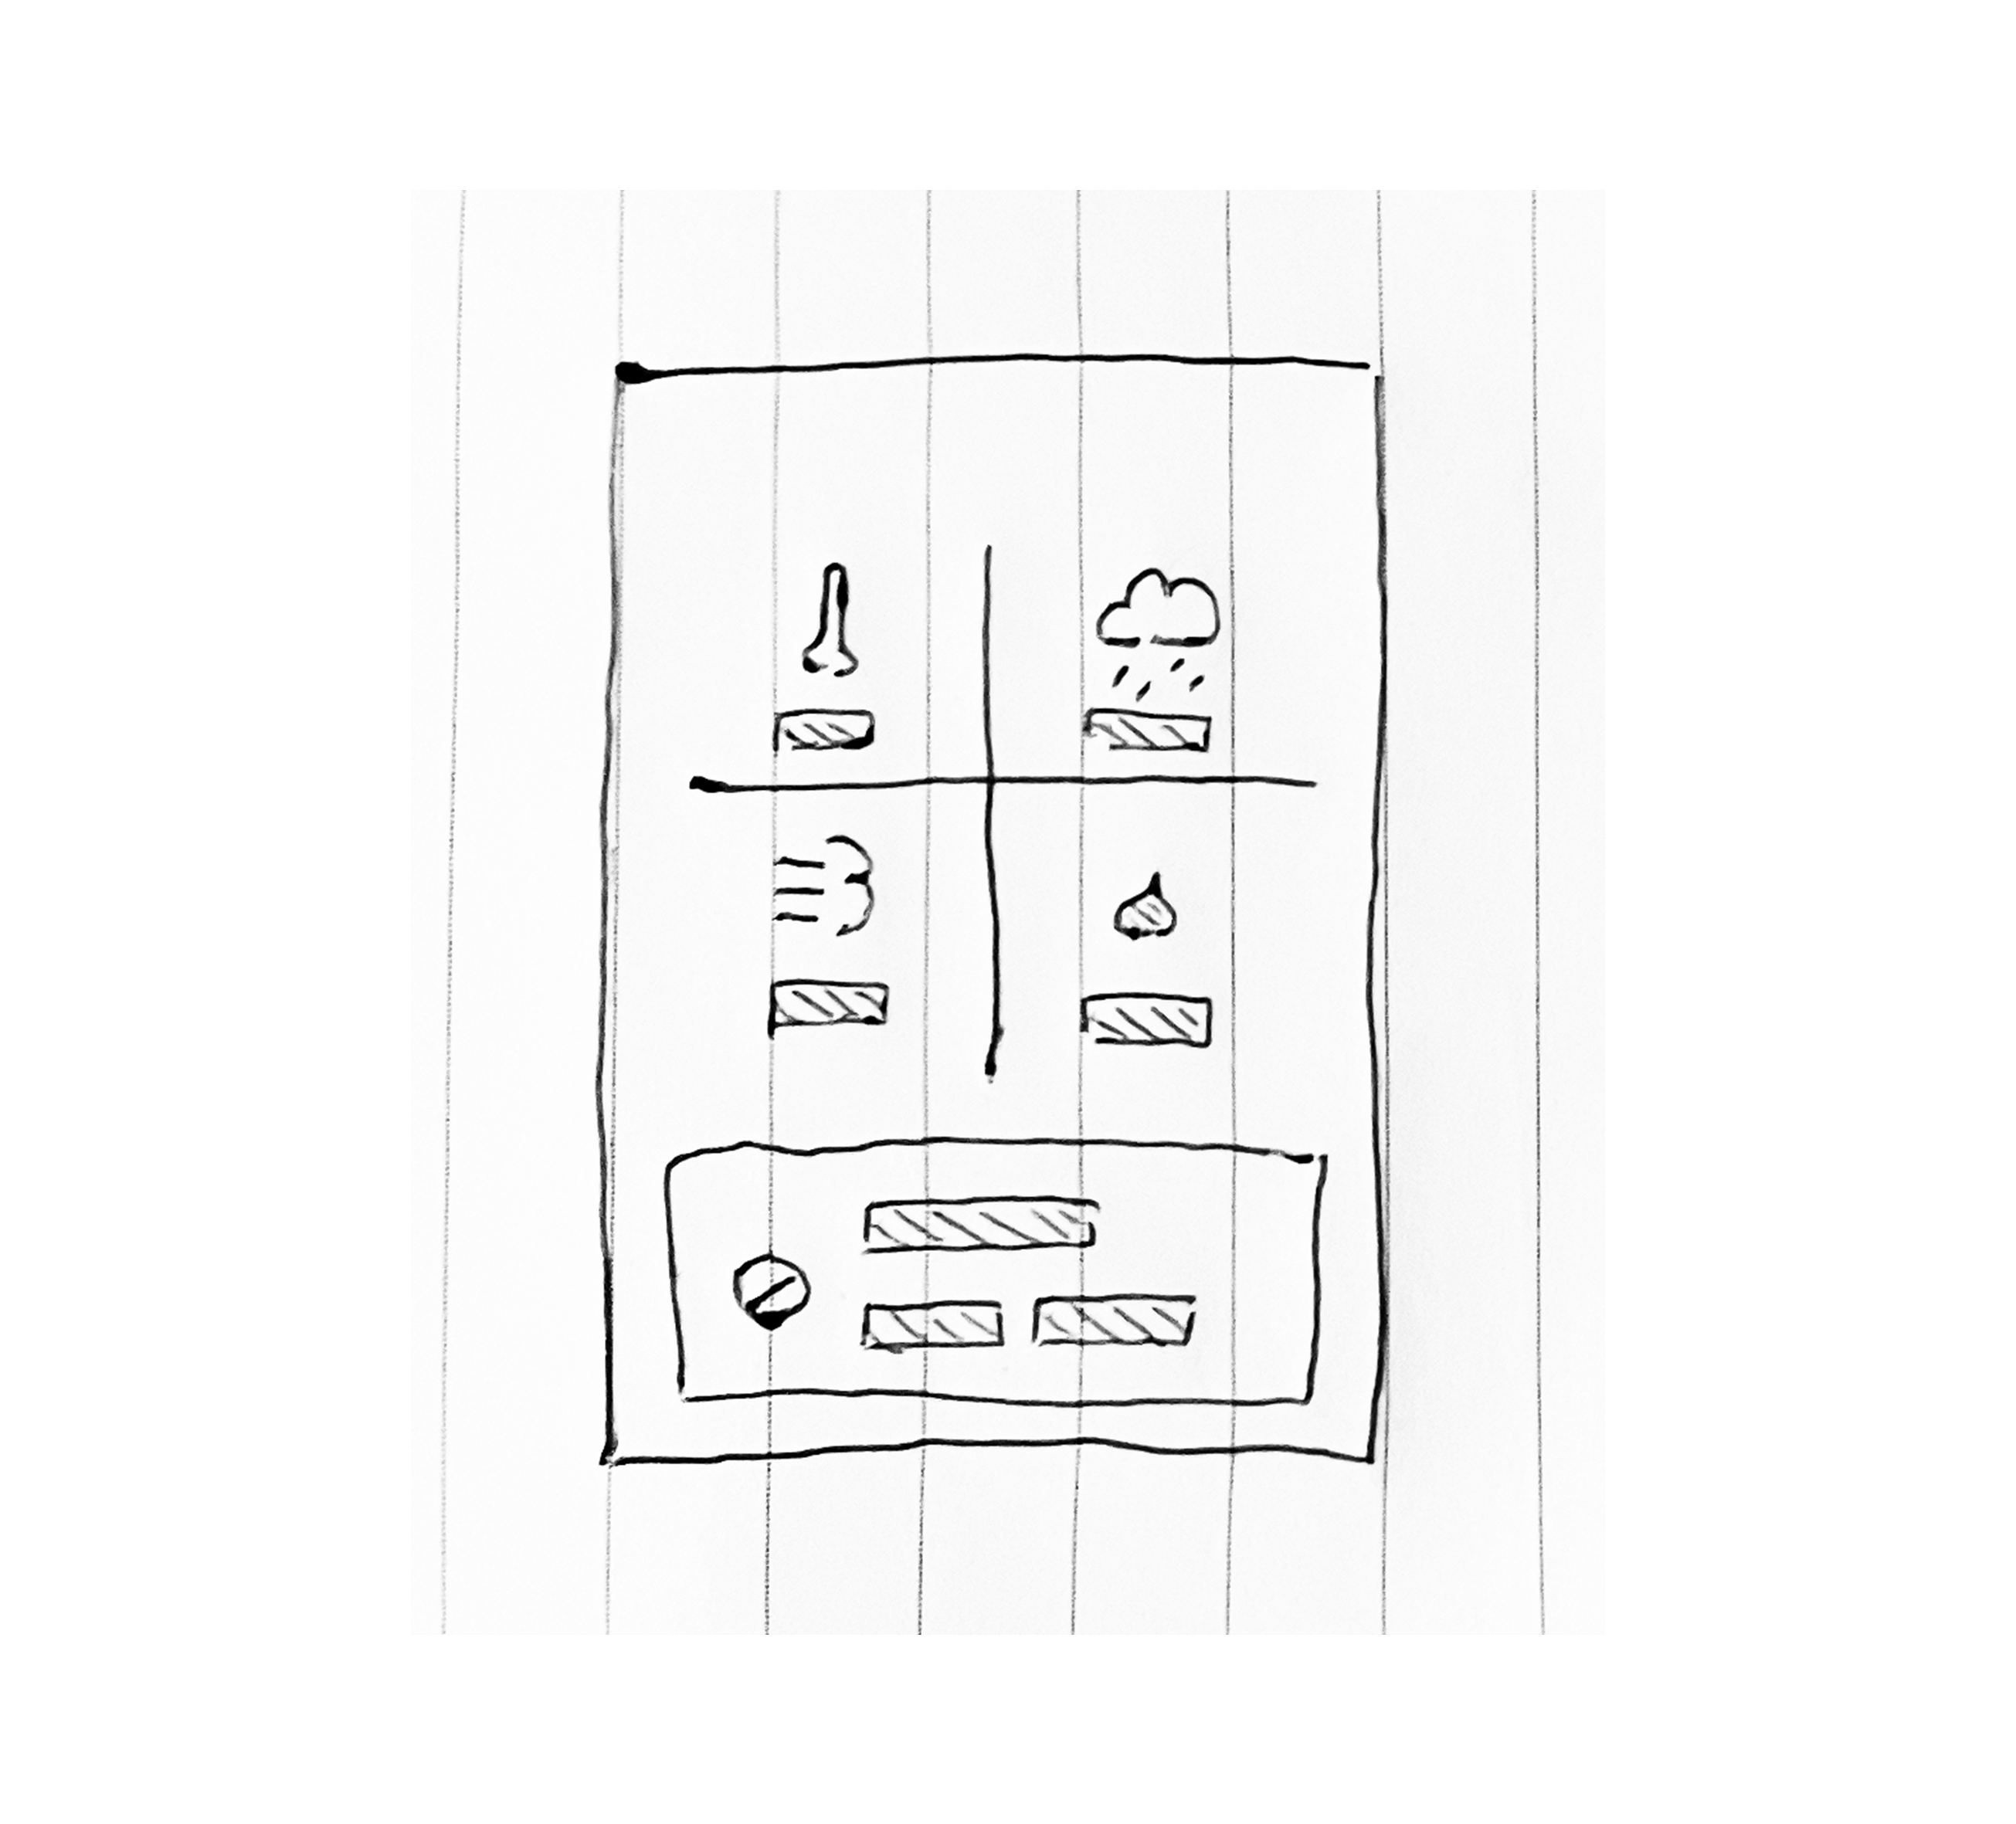
Following the above, we finally opted for a developed version of the previous iteration in which, along with clear plot identification, each of the relevant climatic factors would also be shown and those that are problematic for the treatment application would be highlighted among them.
Gathering feedback
Prototype
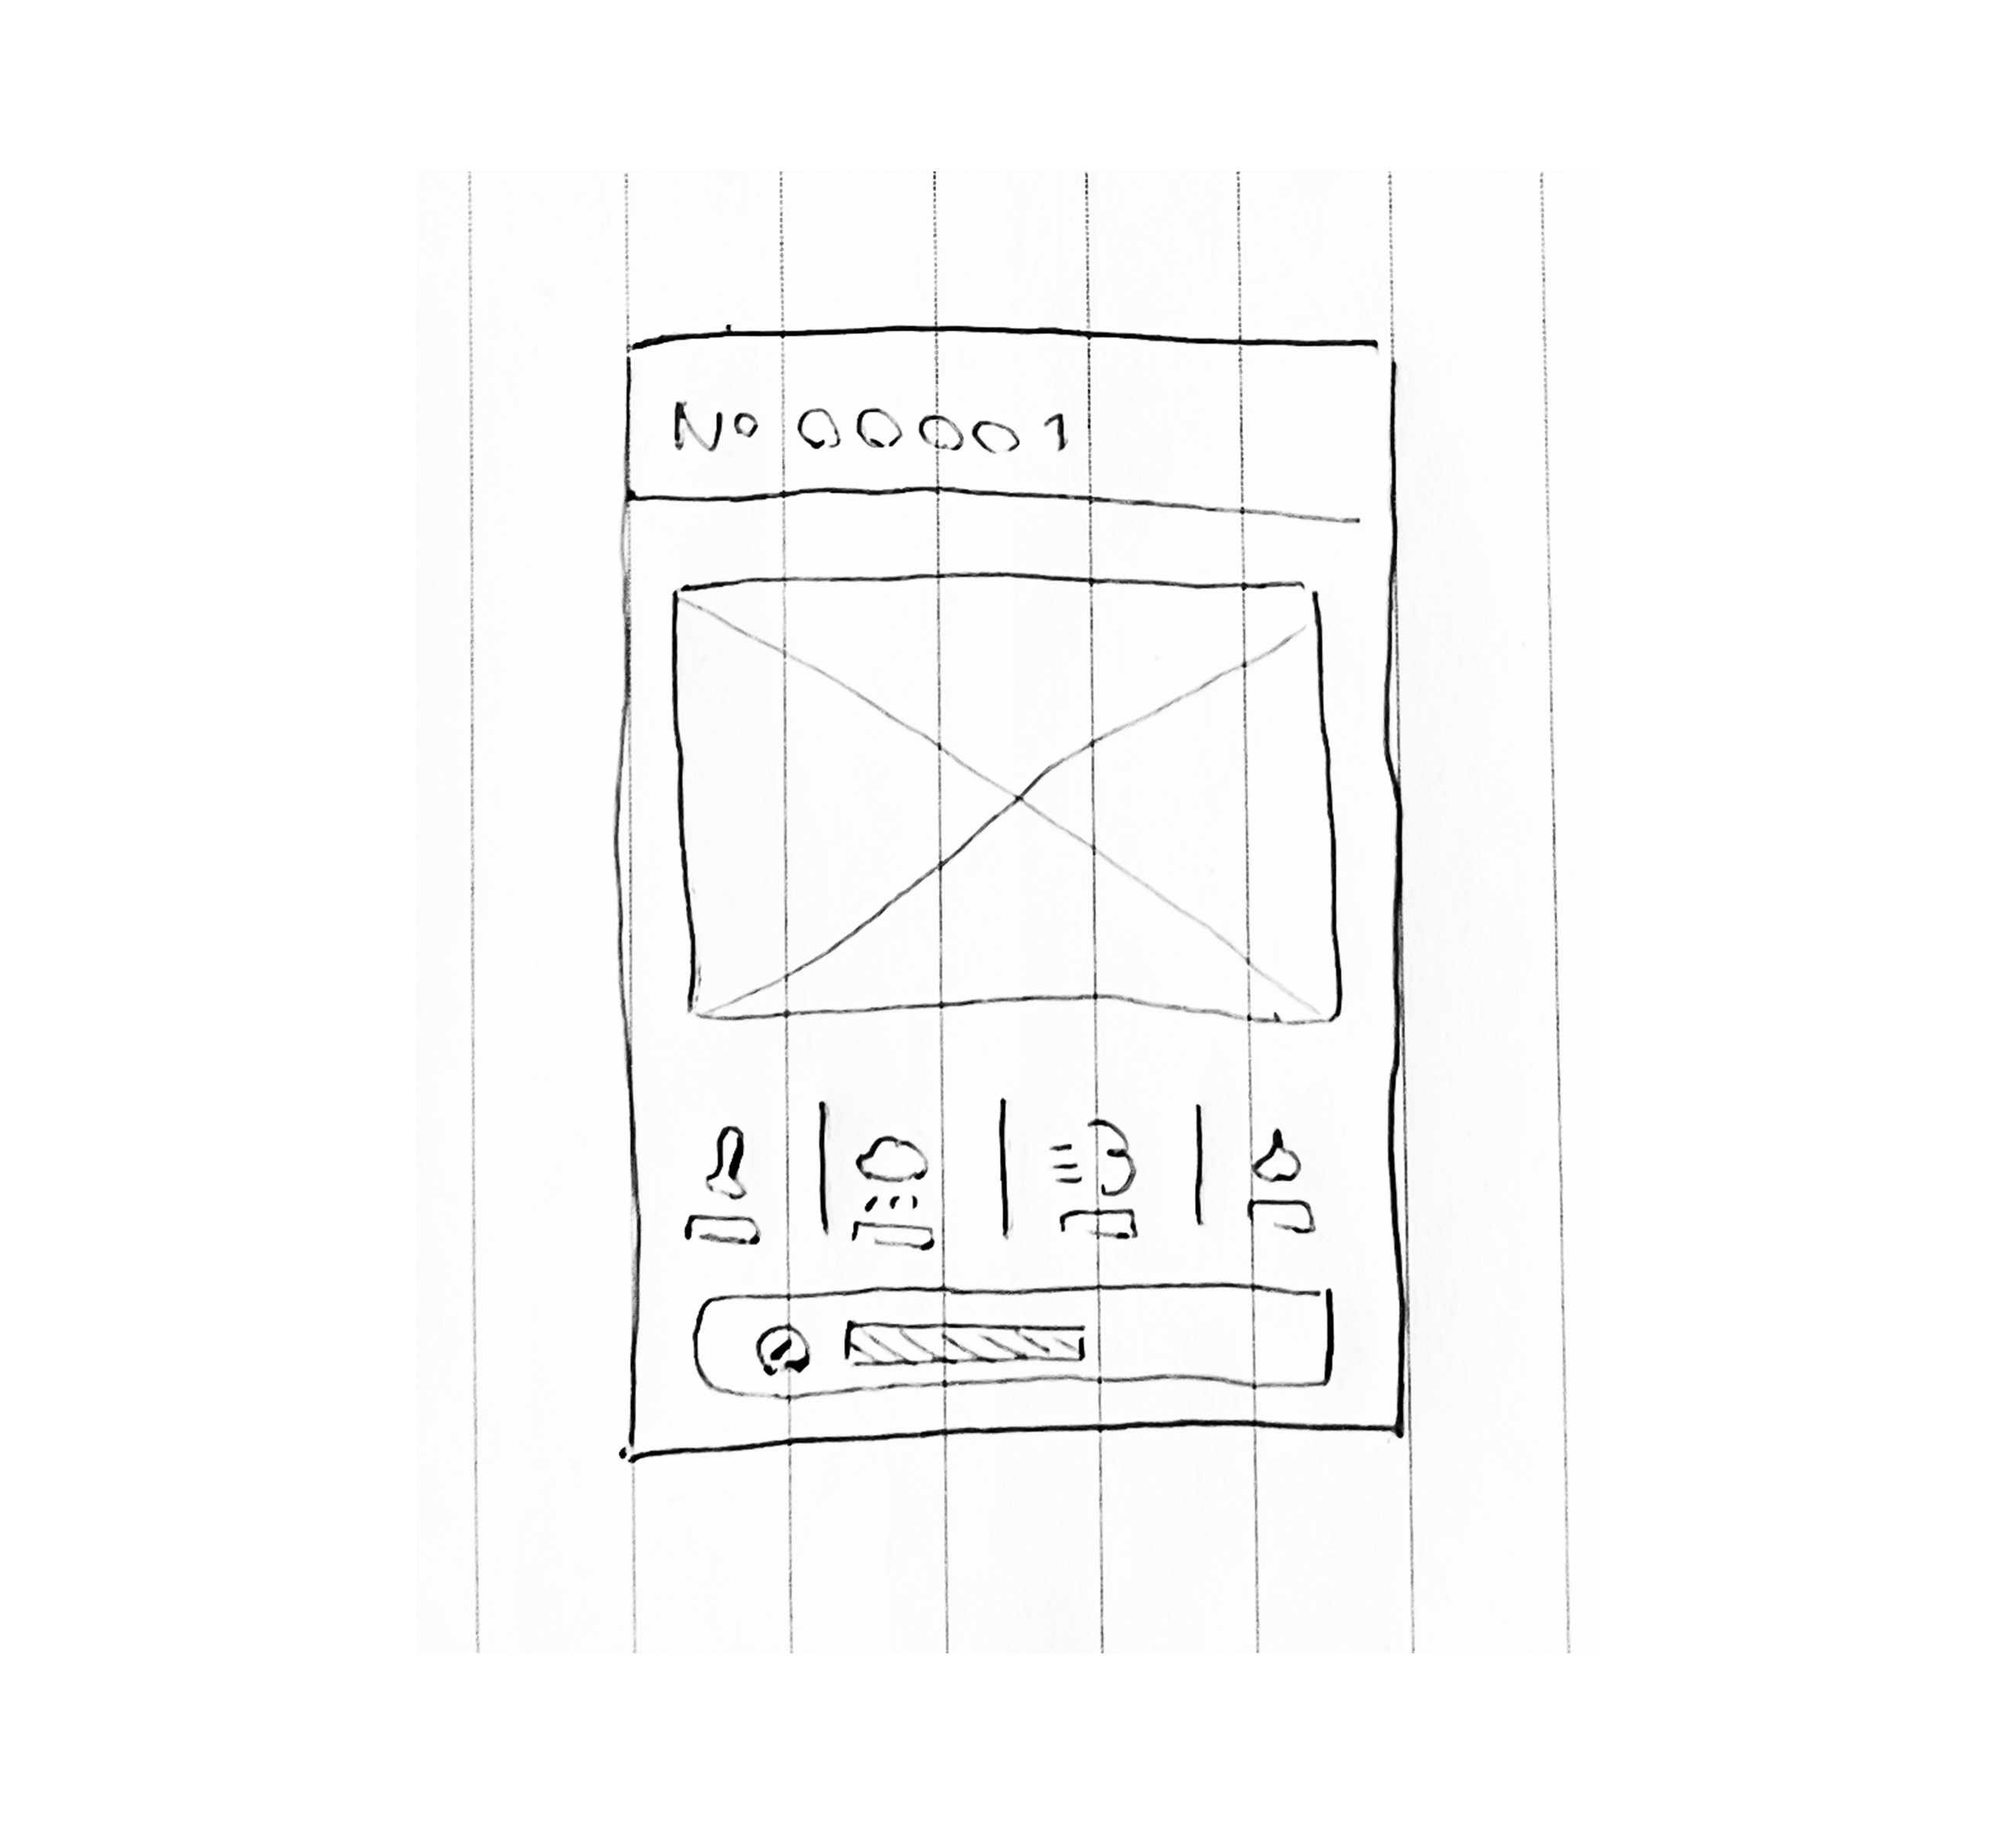
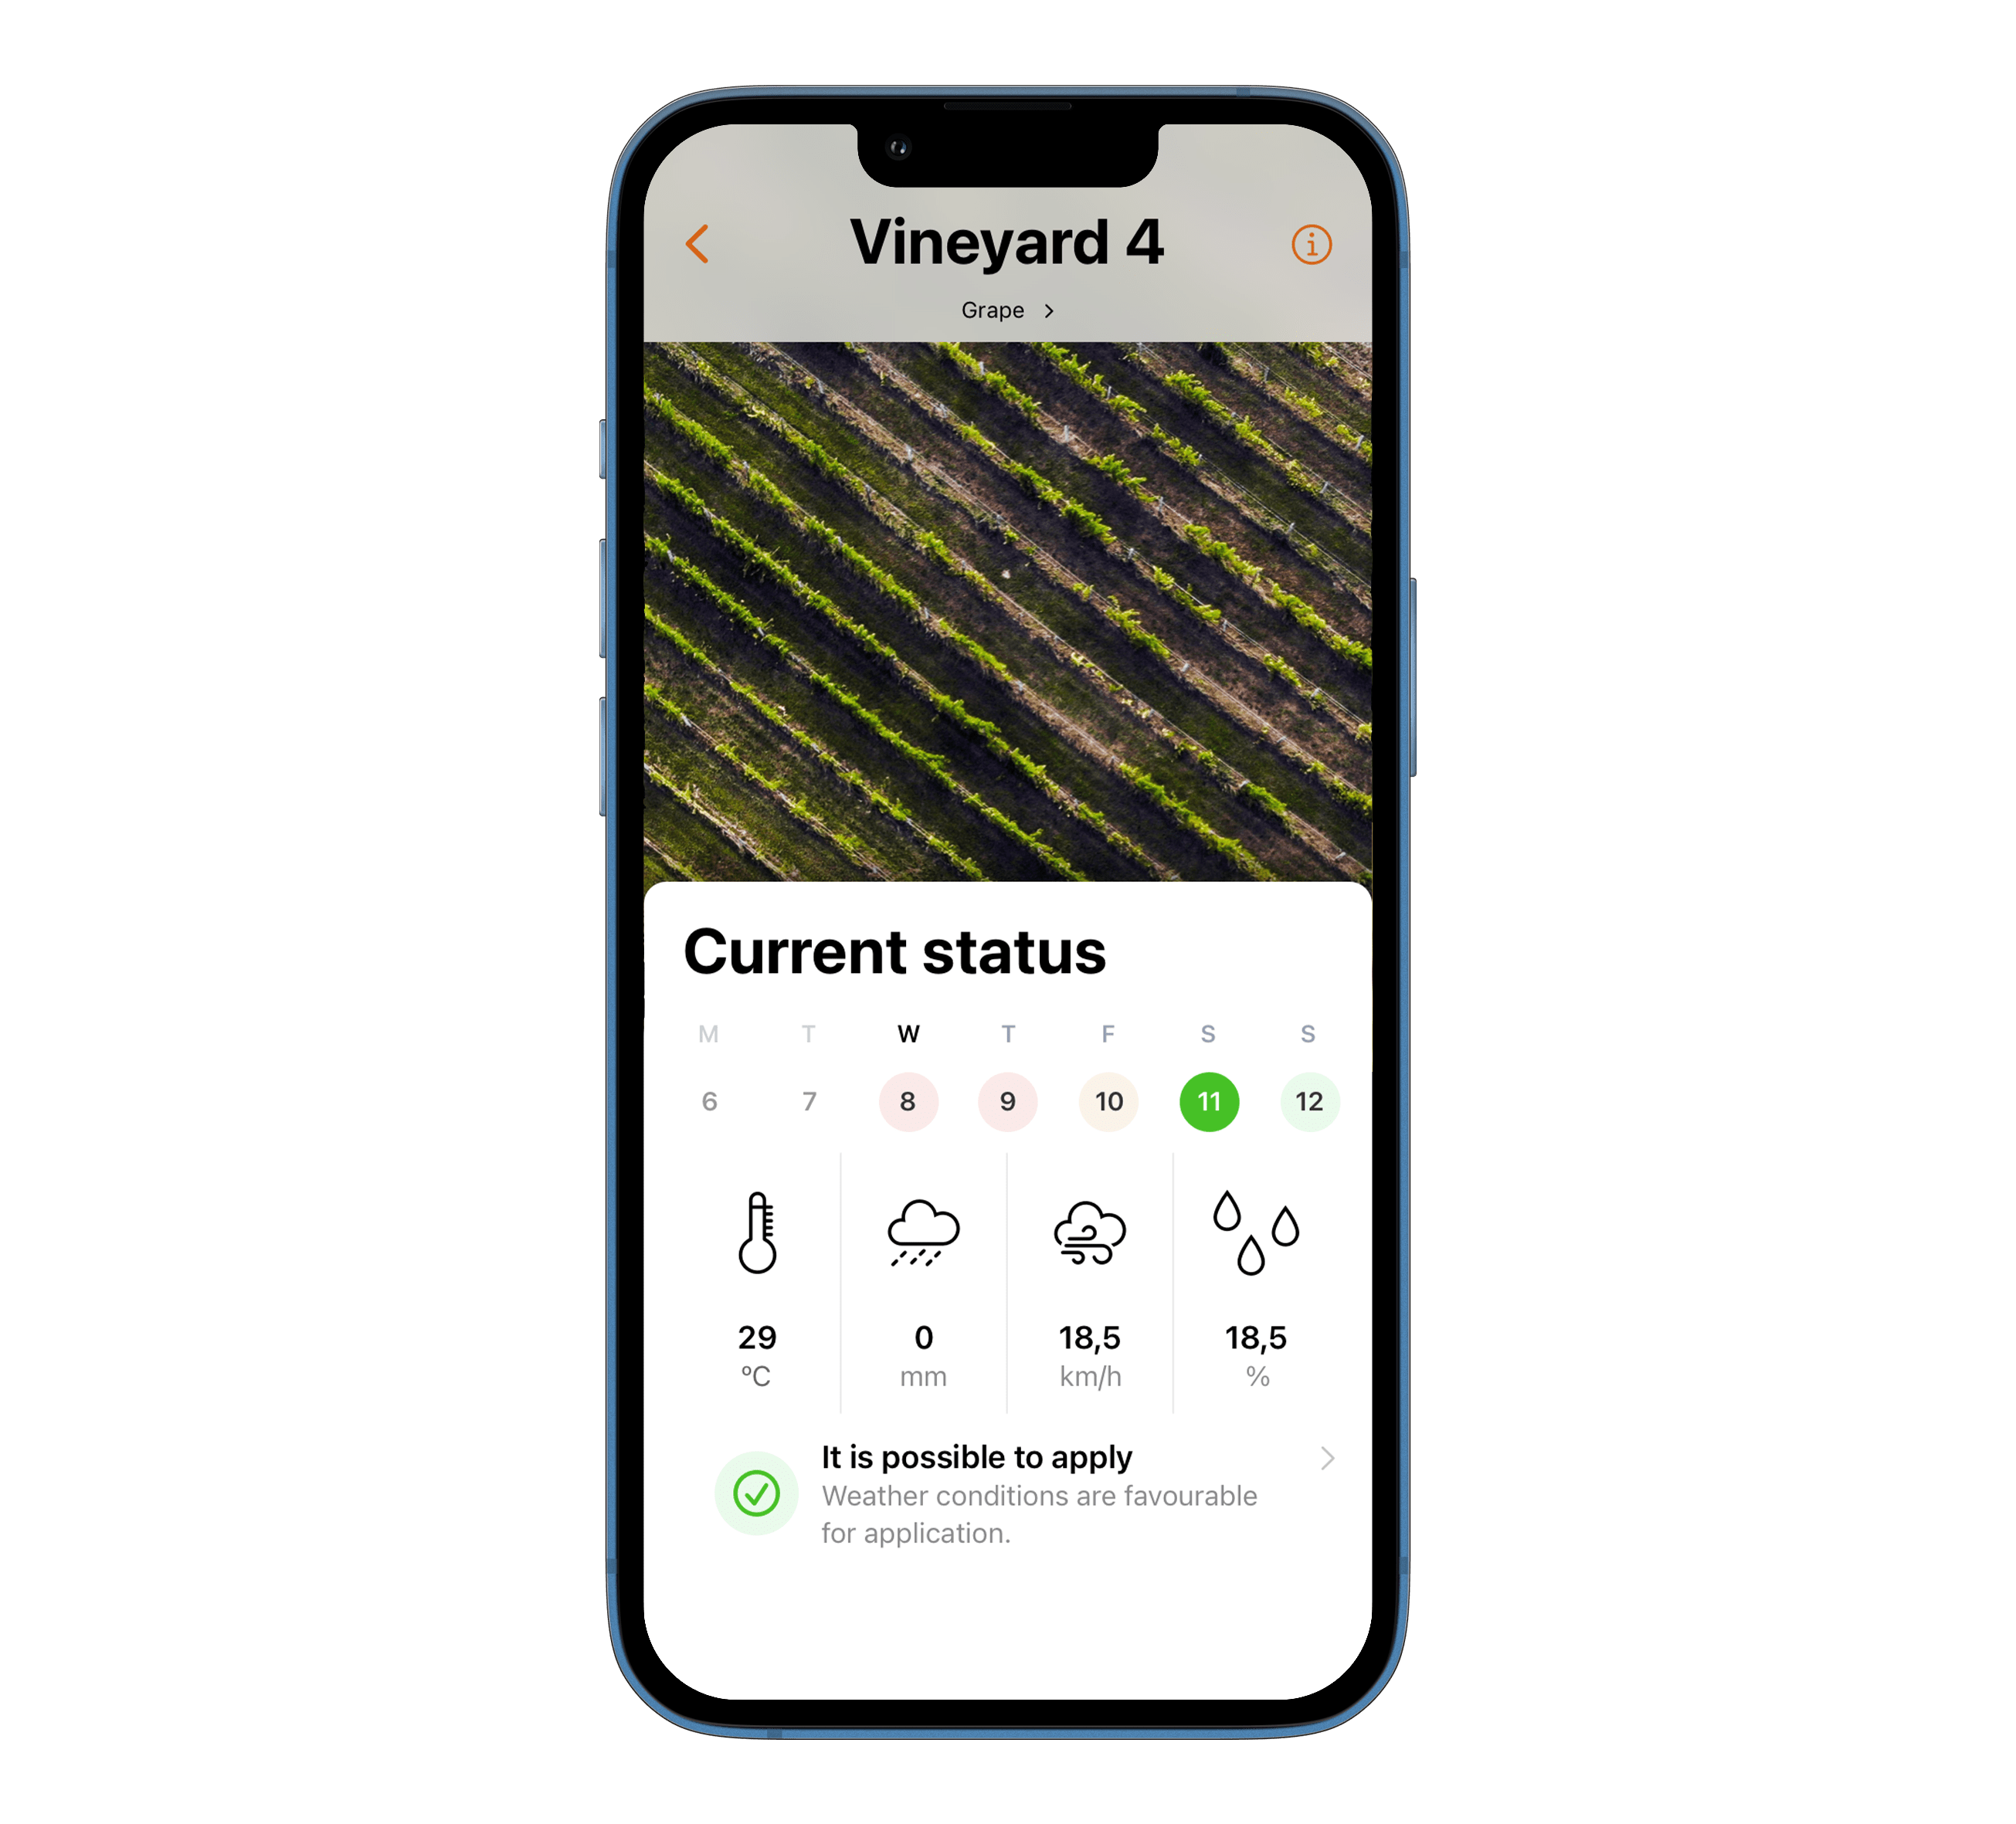
The proposal to be evaluated ended up collecting (and adapting to each system) all the exploration carried out in the research phase: the new feature would show, for each plot, its unique name, its satellite image and the four atmospheric parameters relevant to our challenge: temperature, rainfall, wind and humidity.
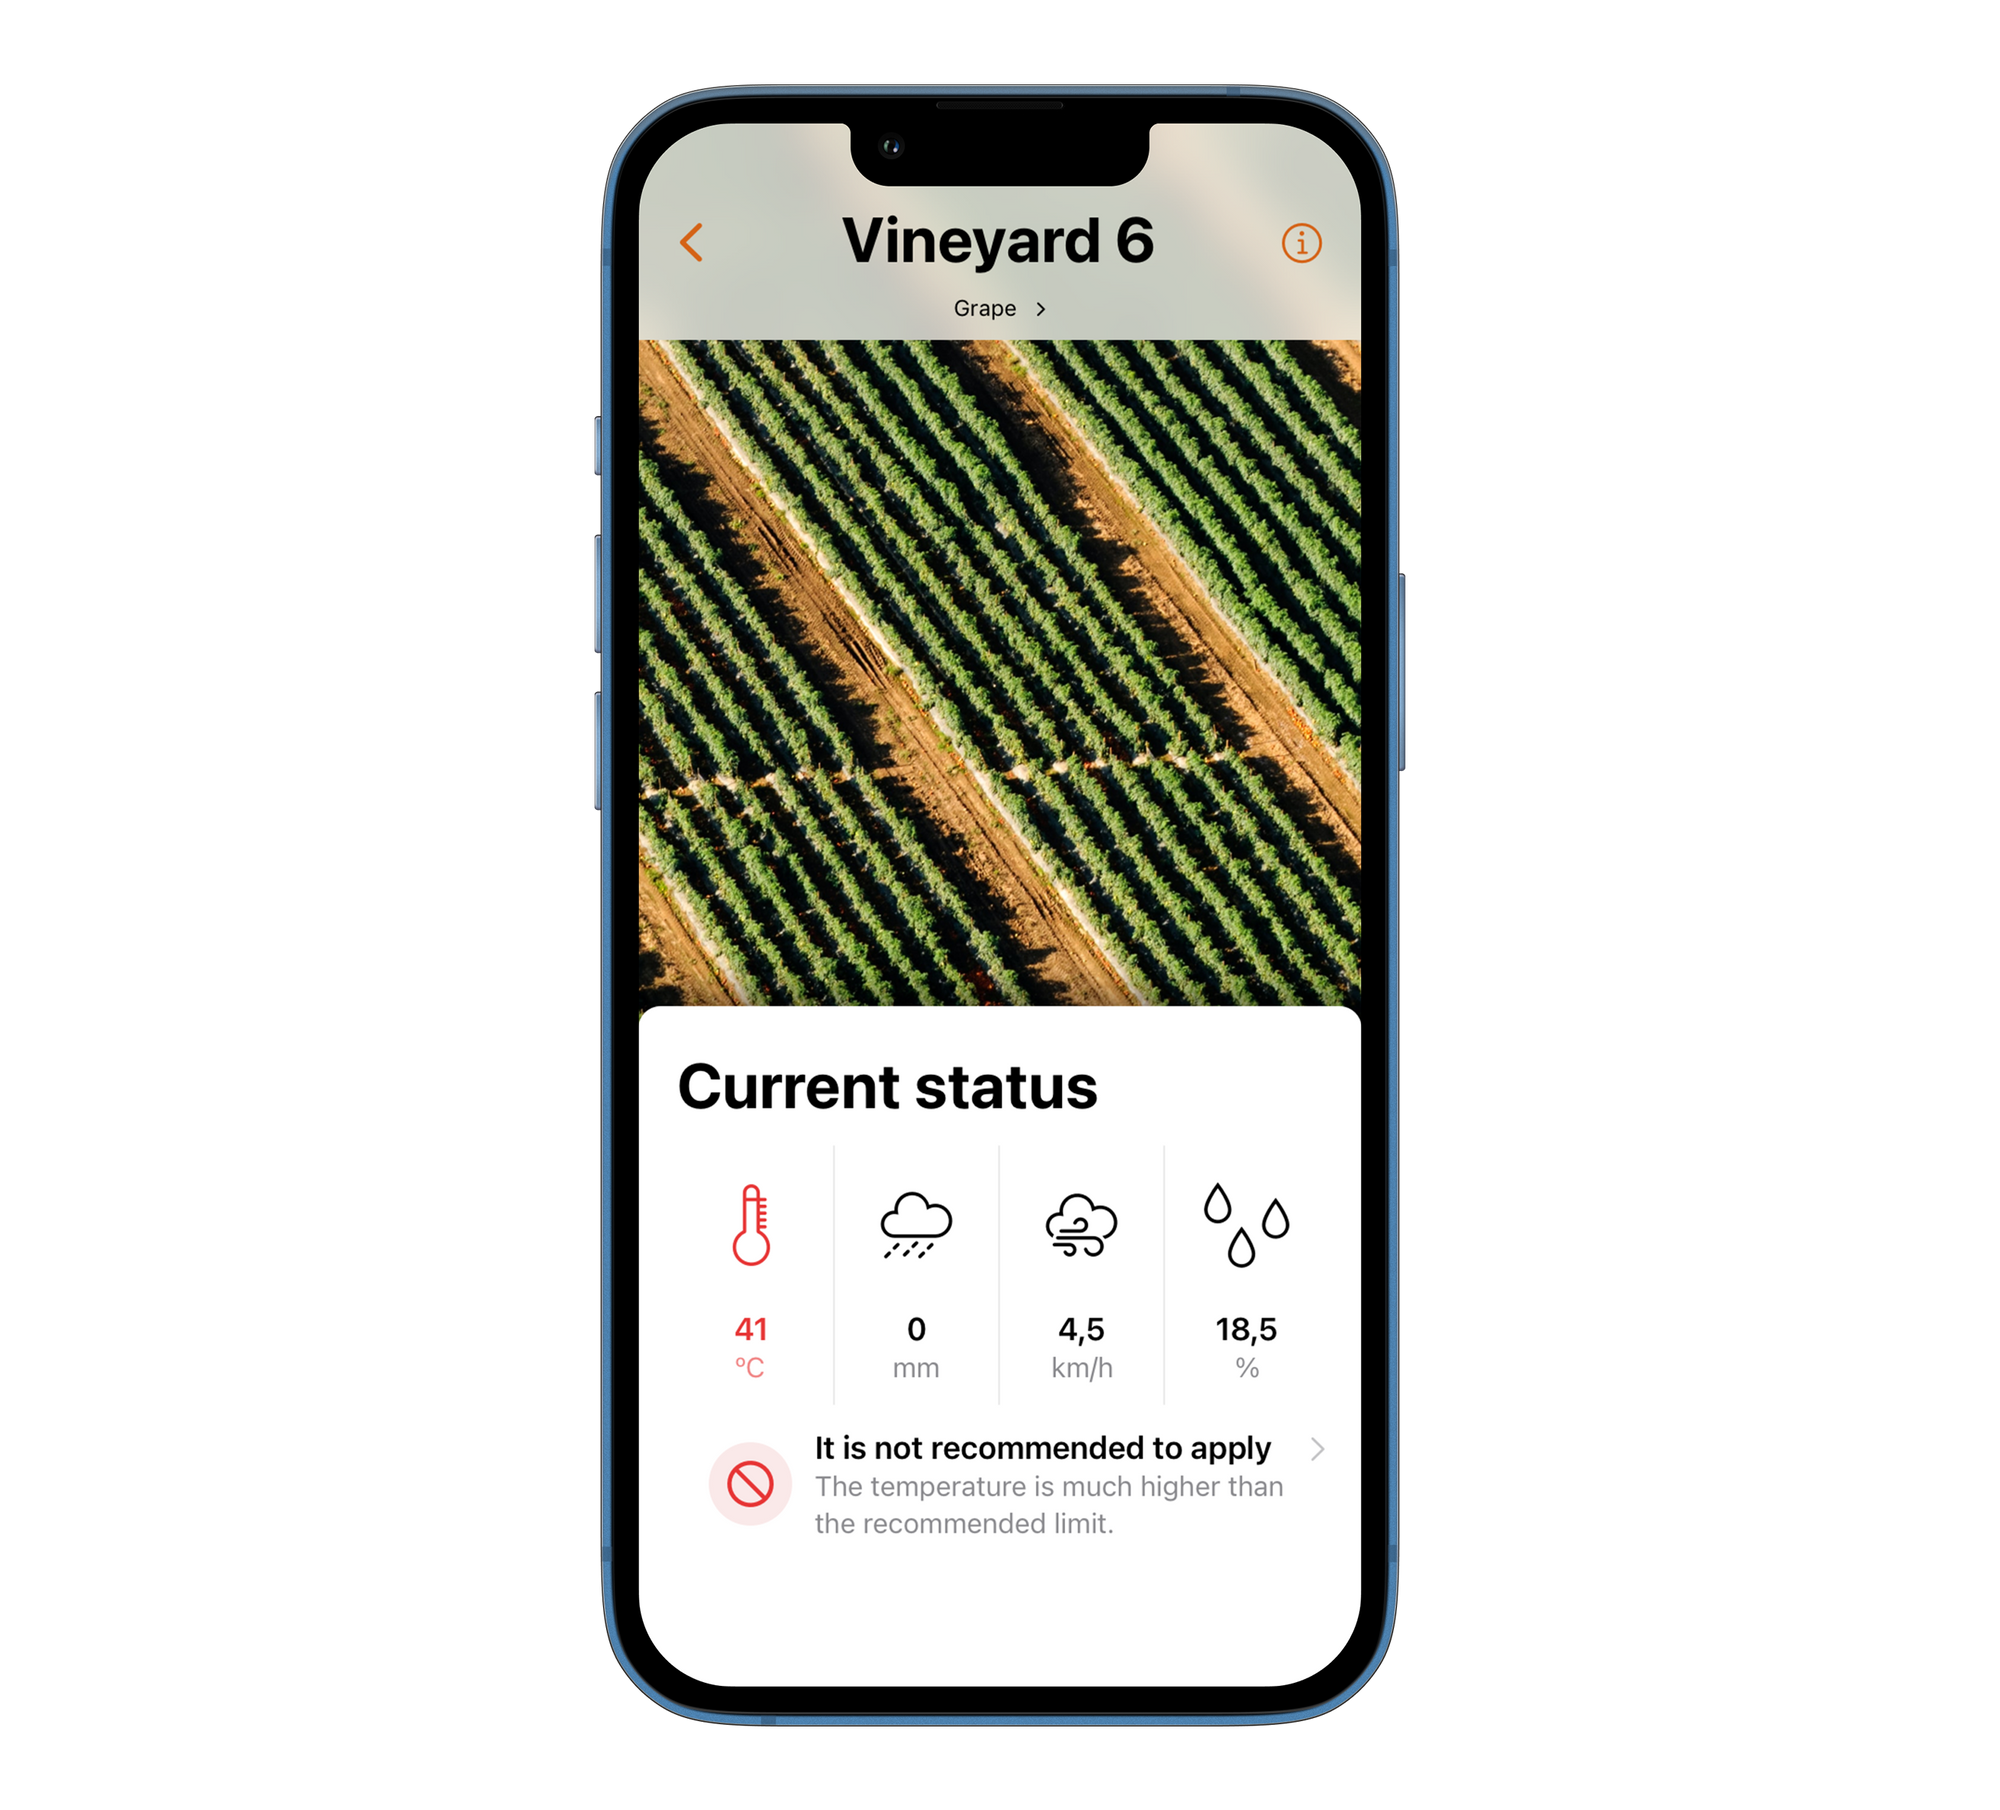
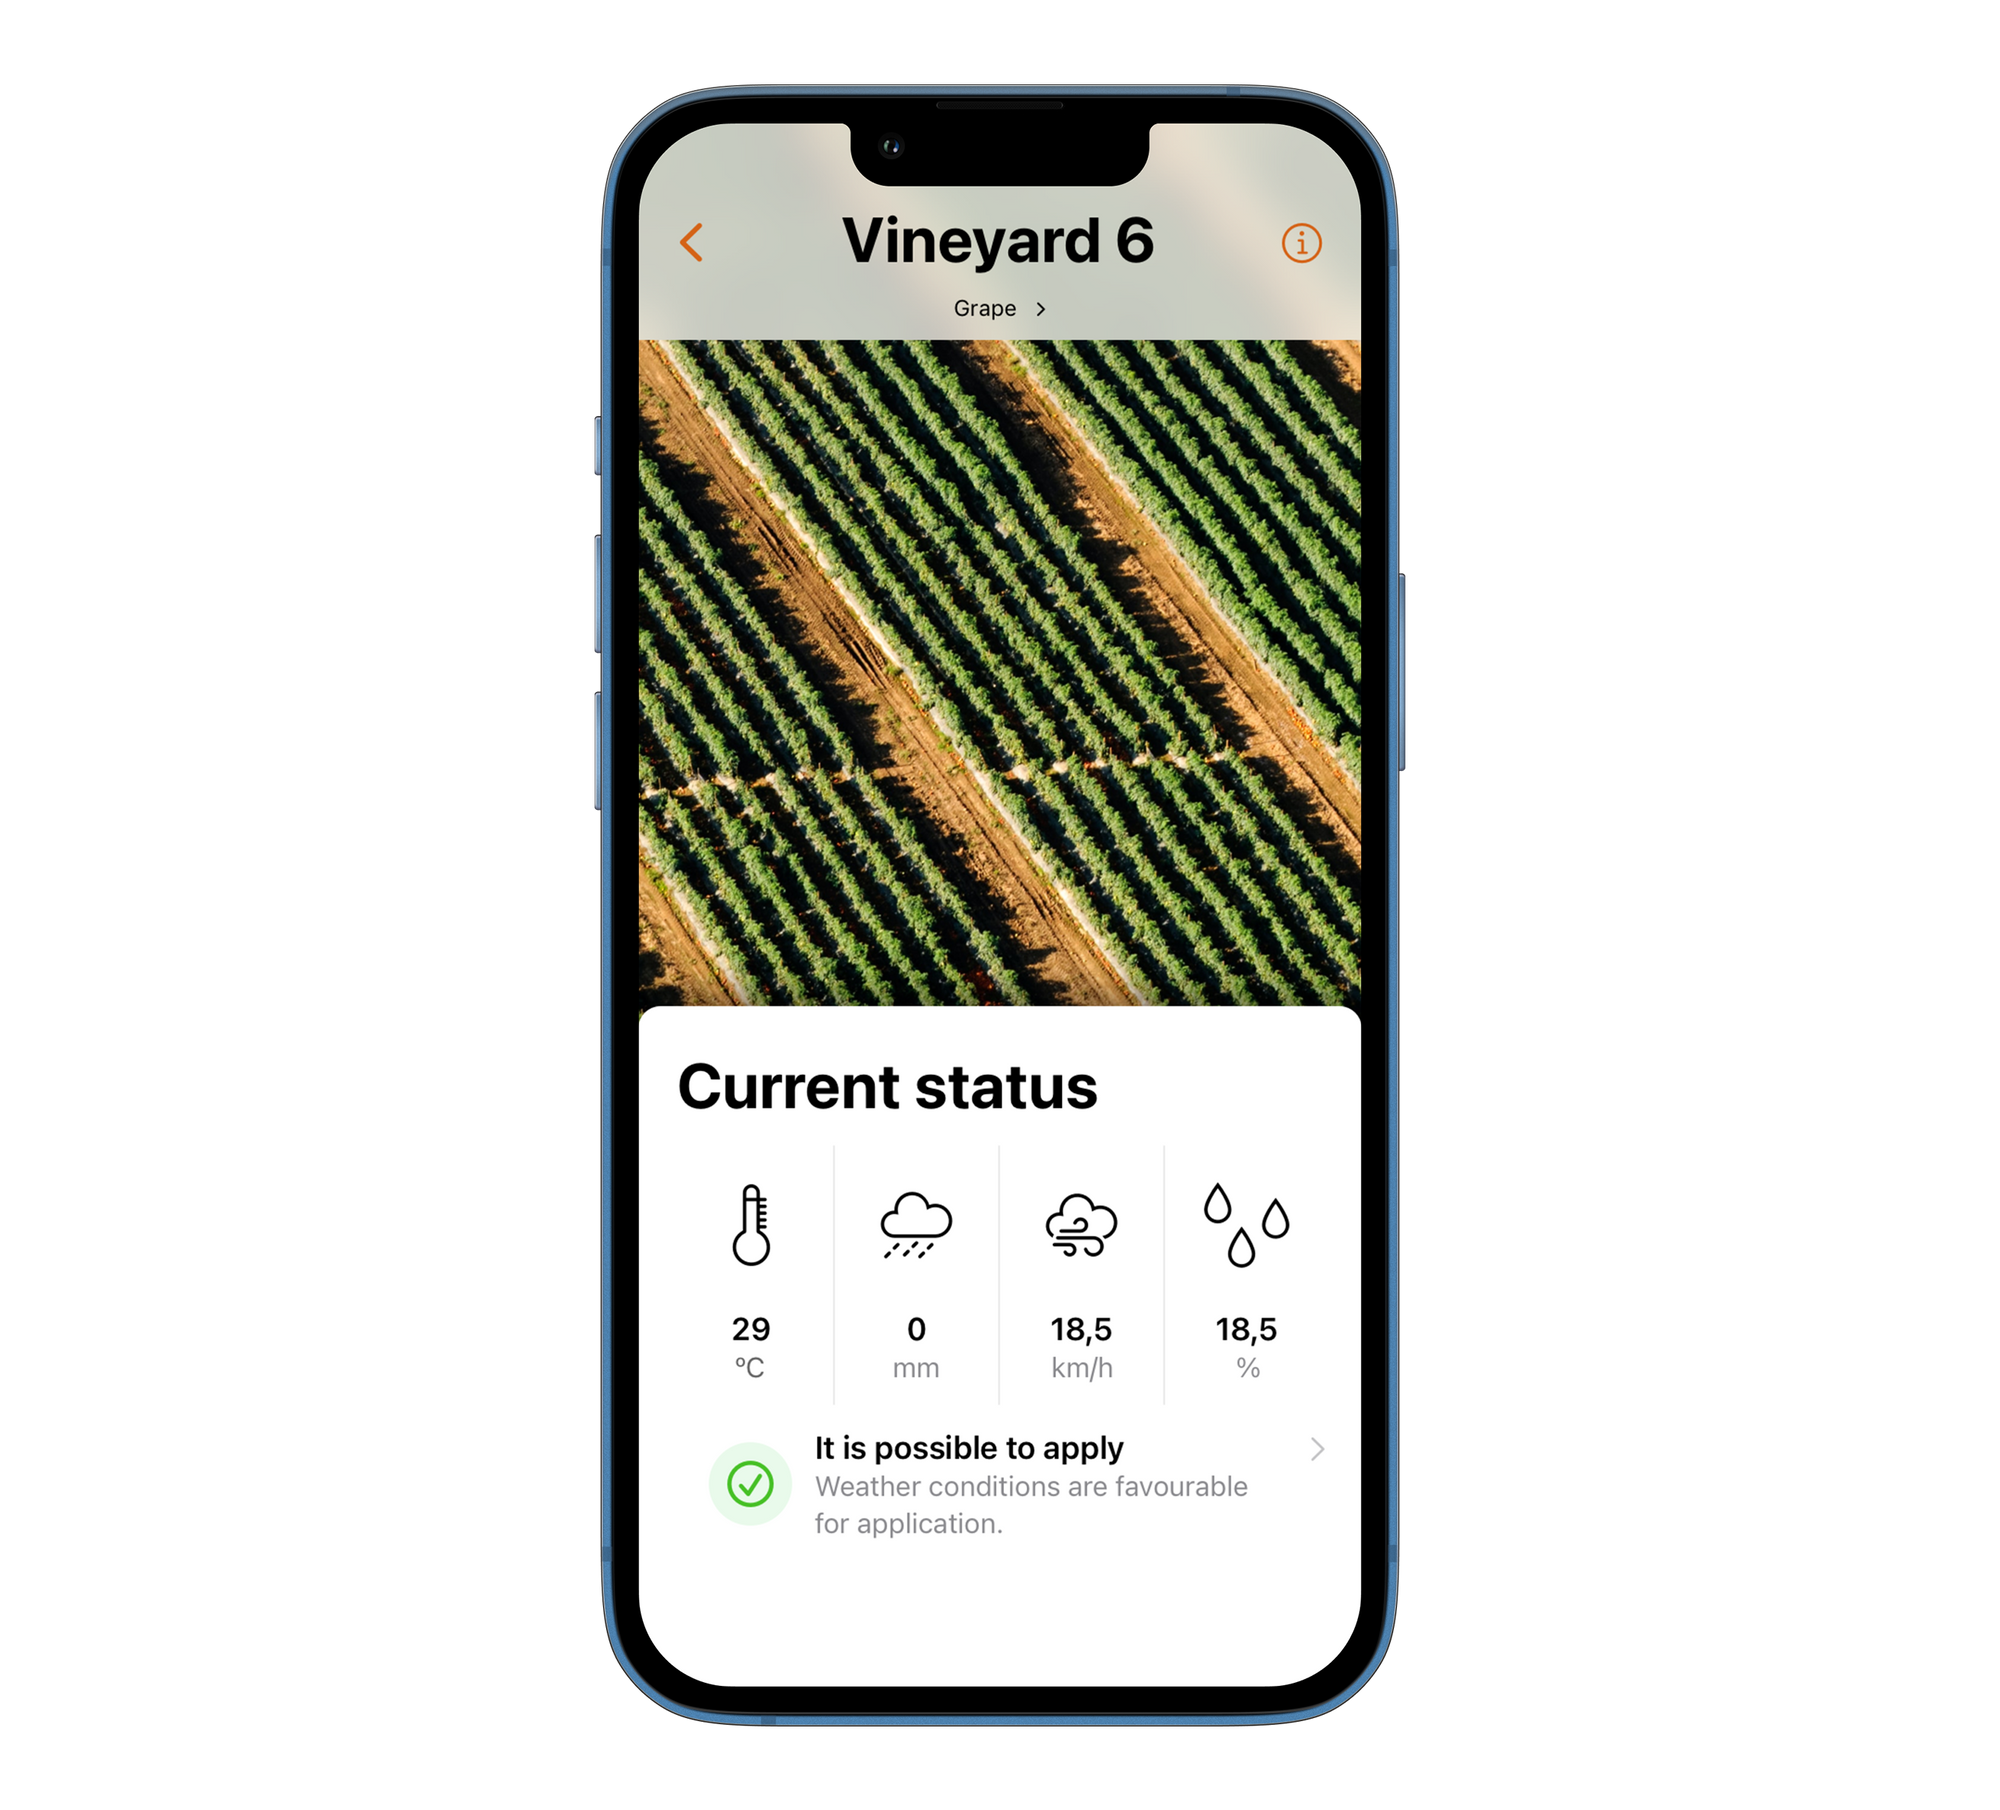
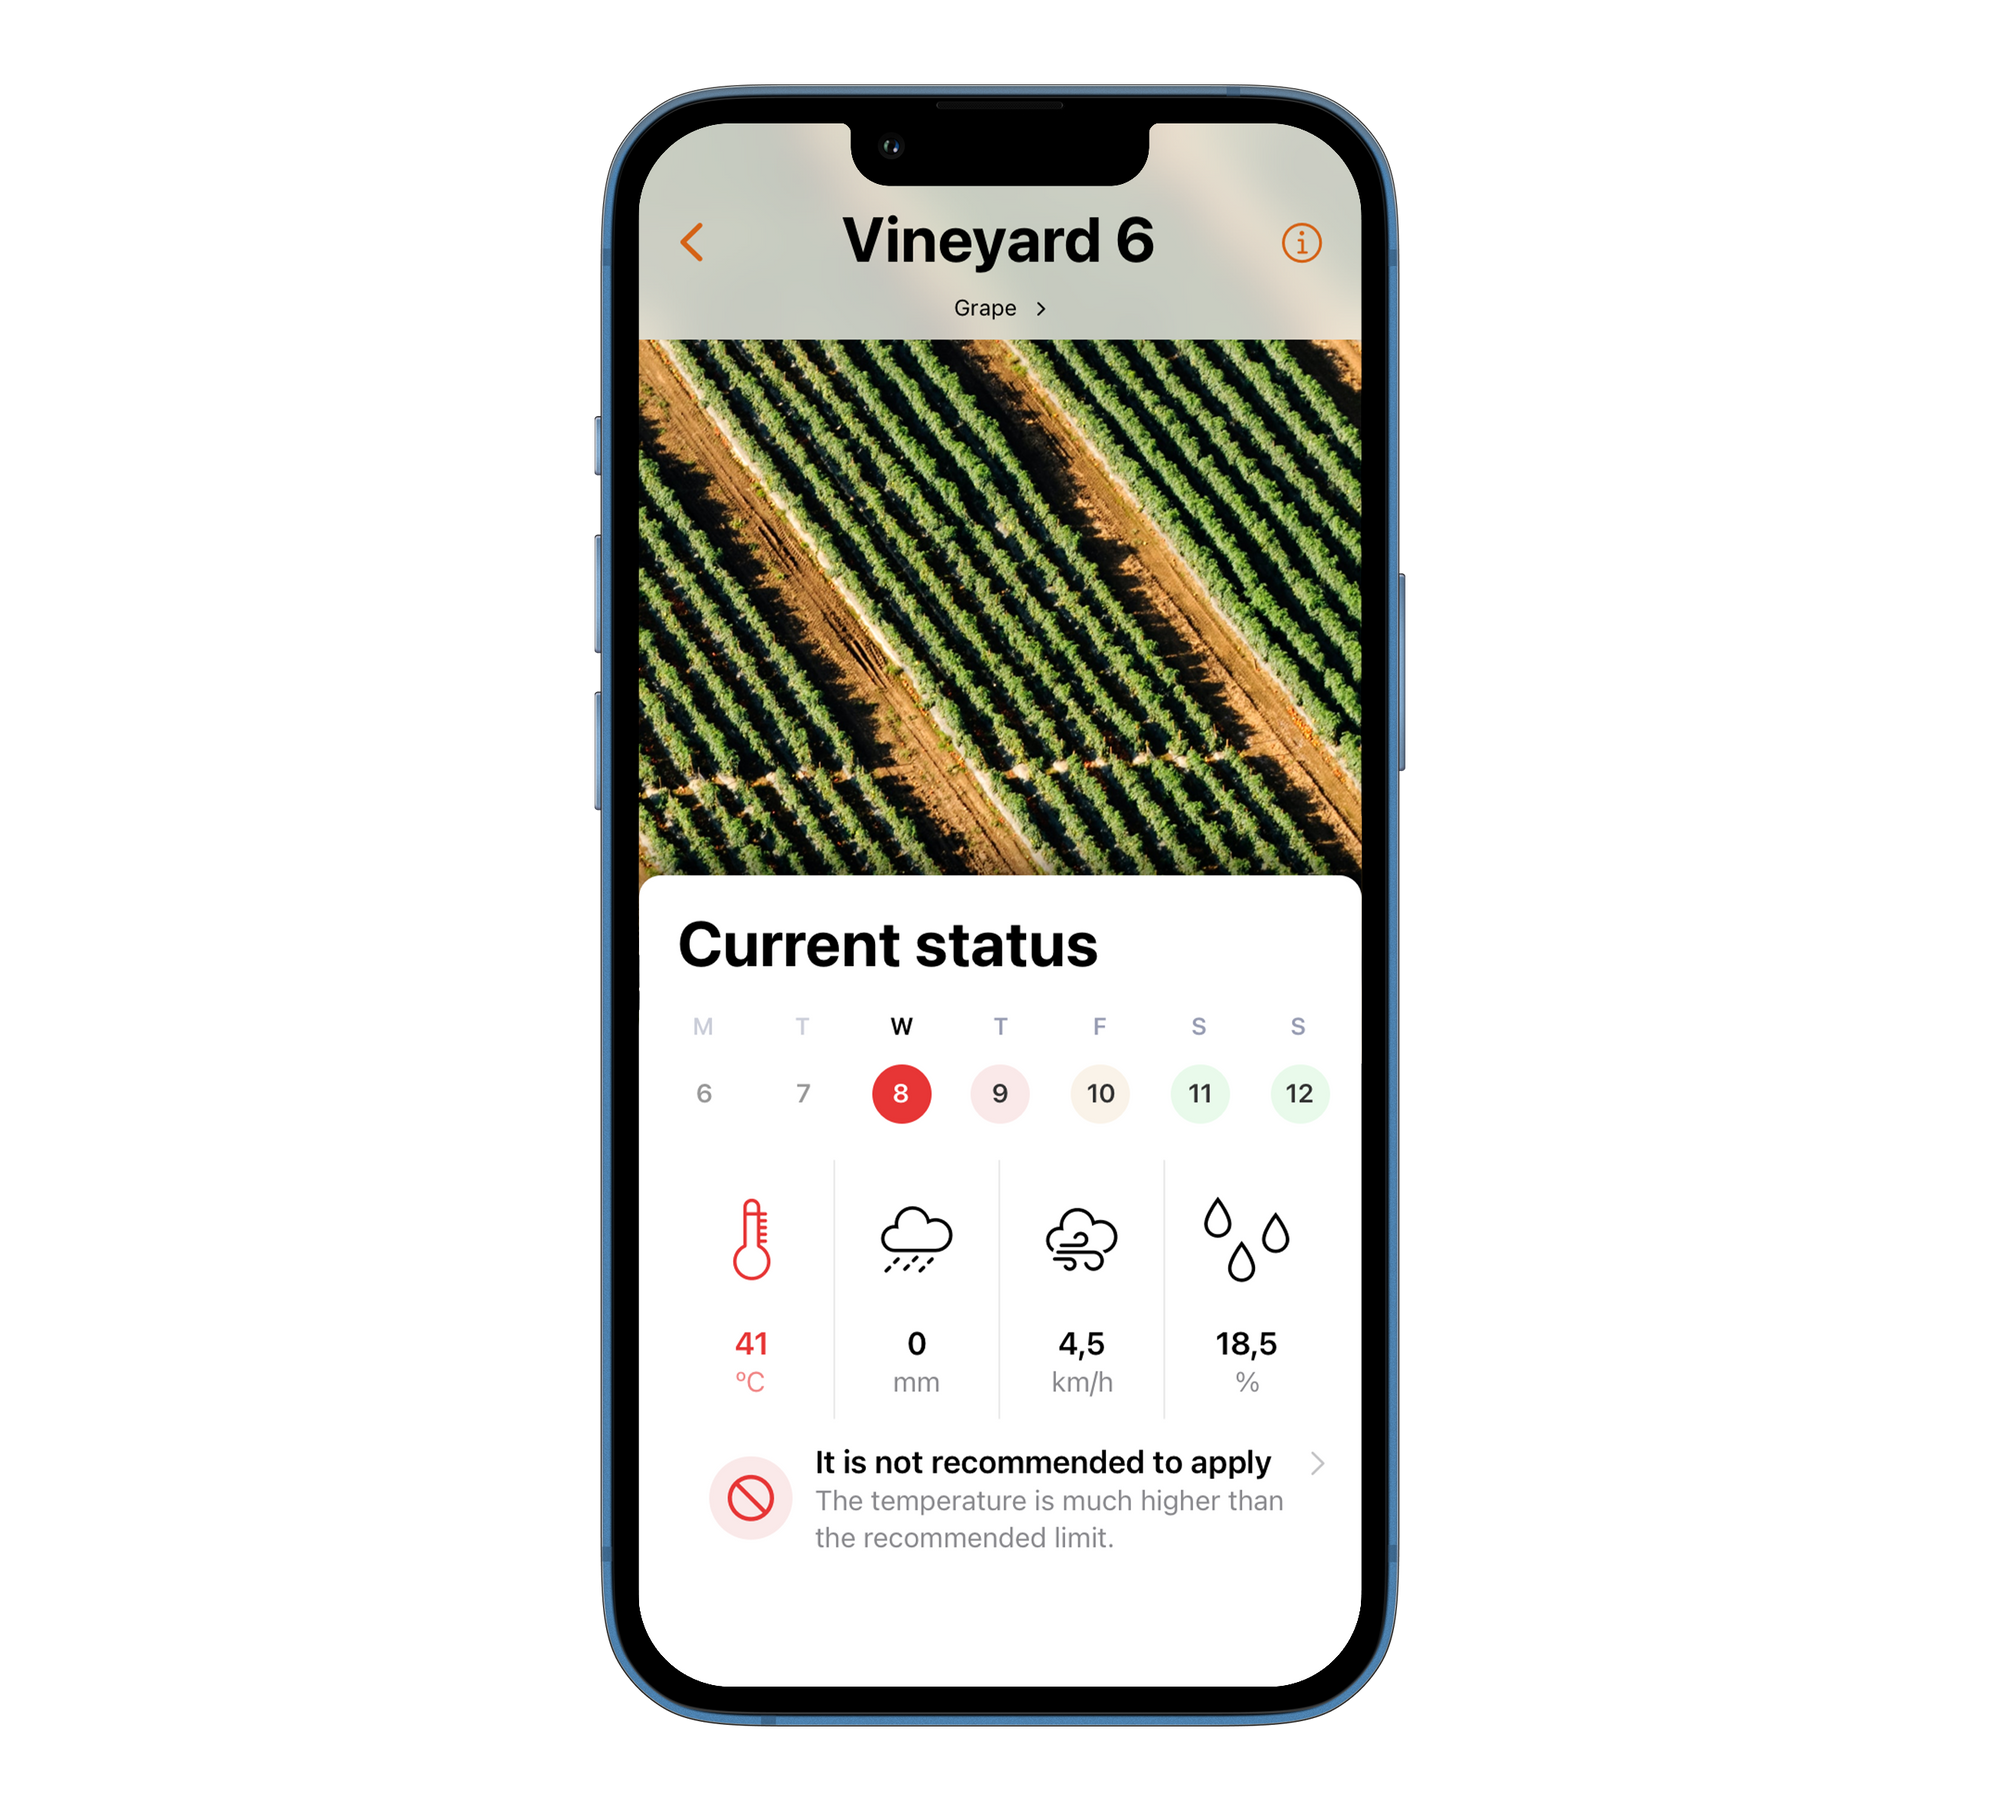
Thus, the application would clearly communicate whether or not to apply the plant protection product and the reason for this recommendation, clearly indicating the problematic parameter.
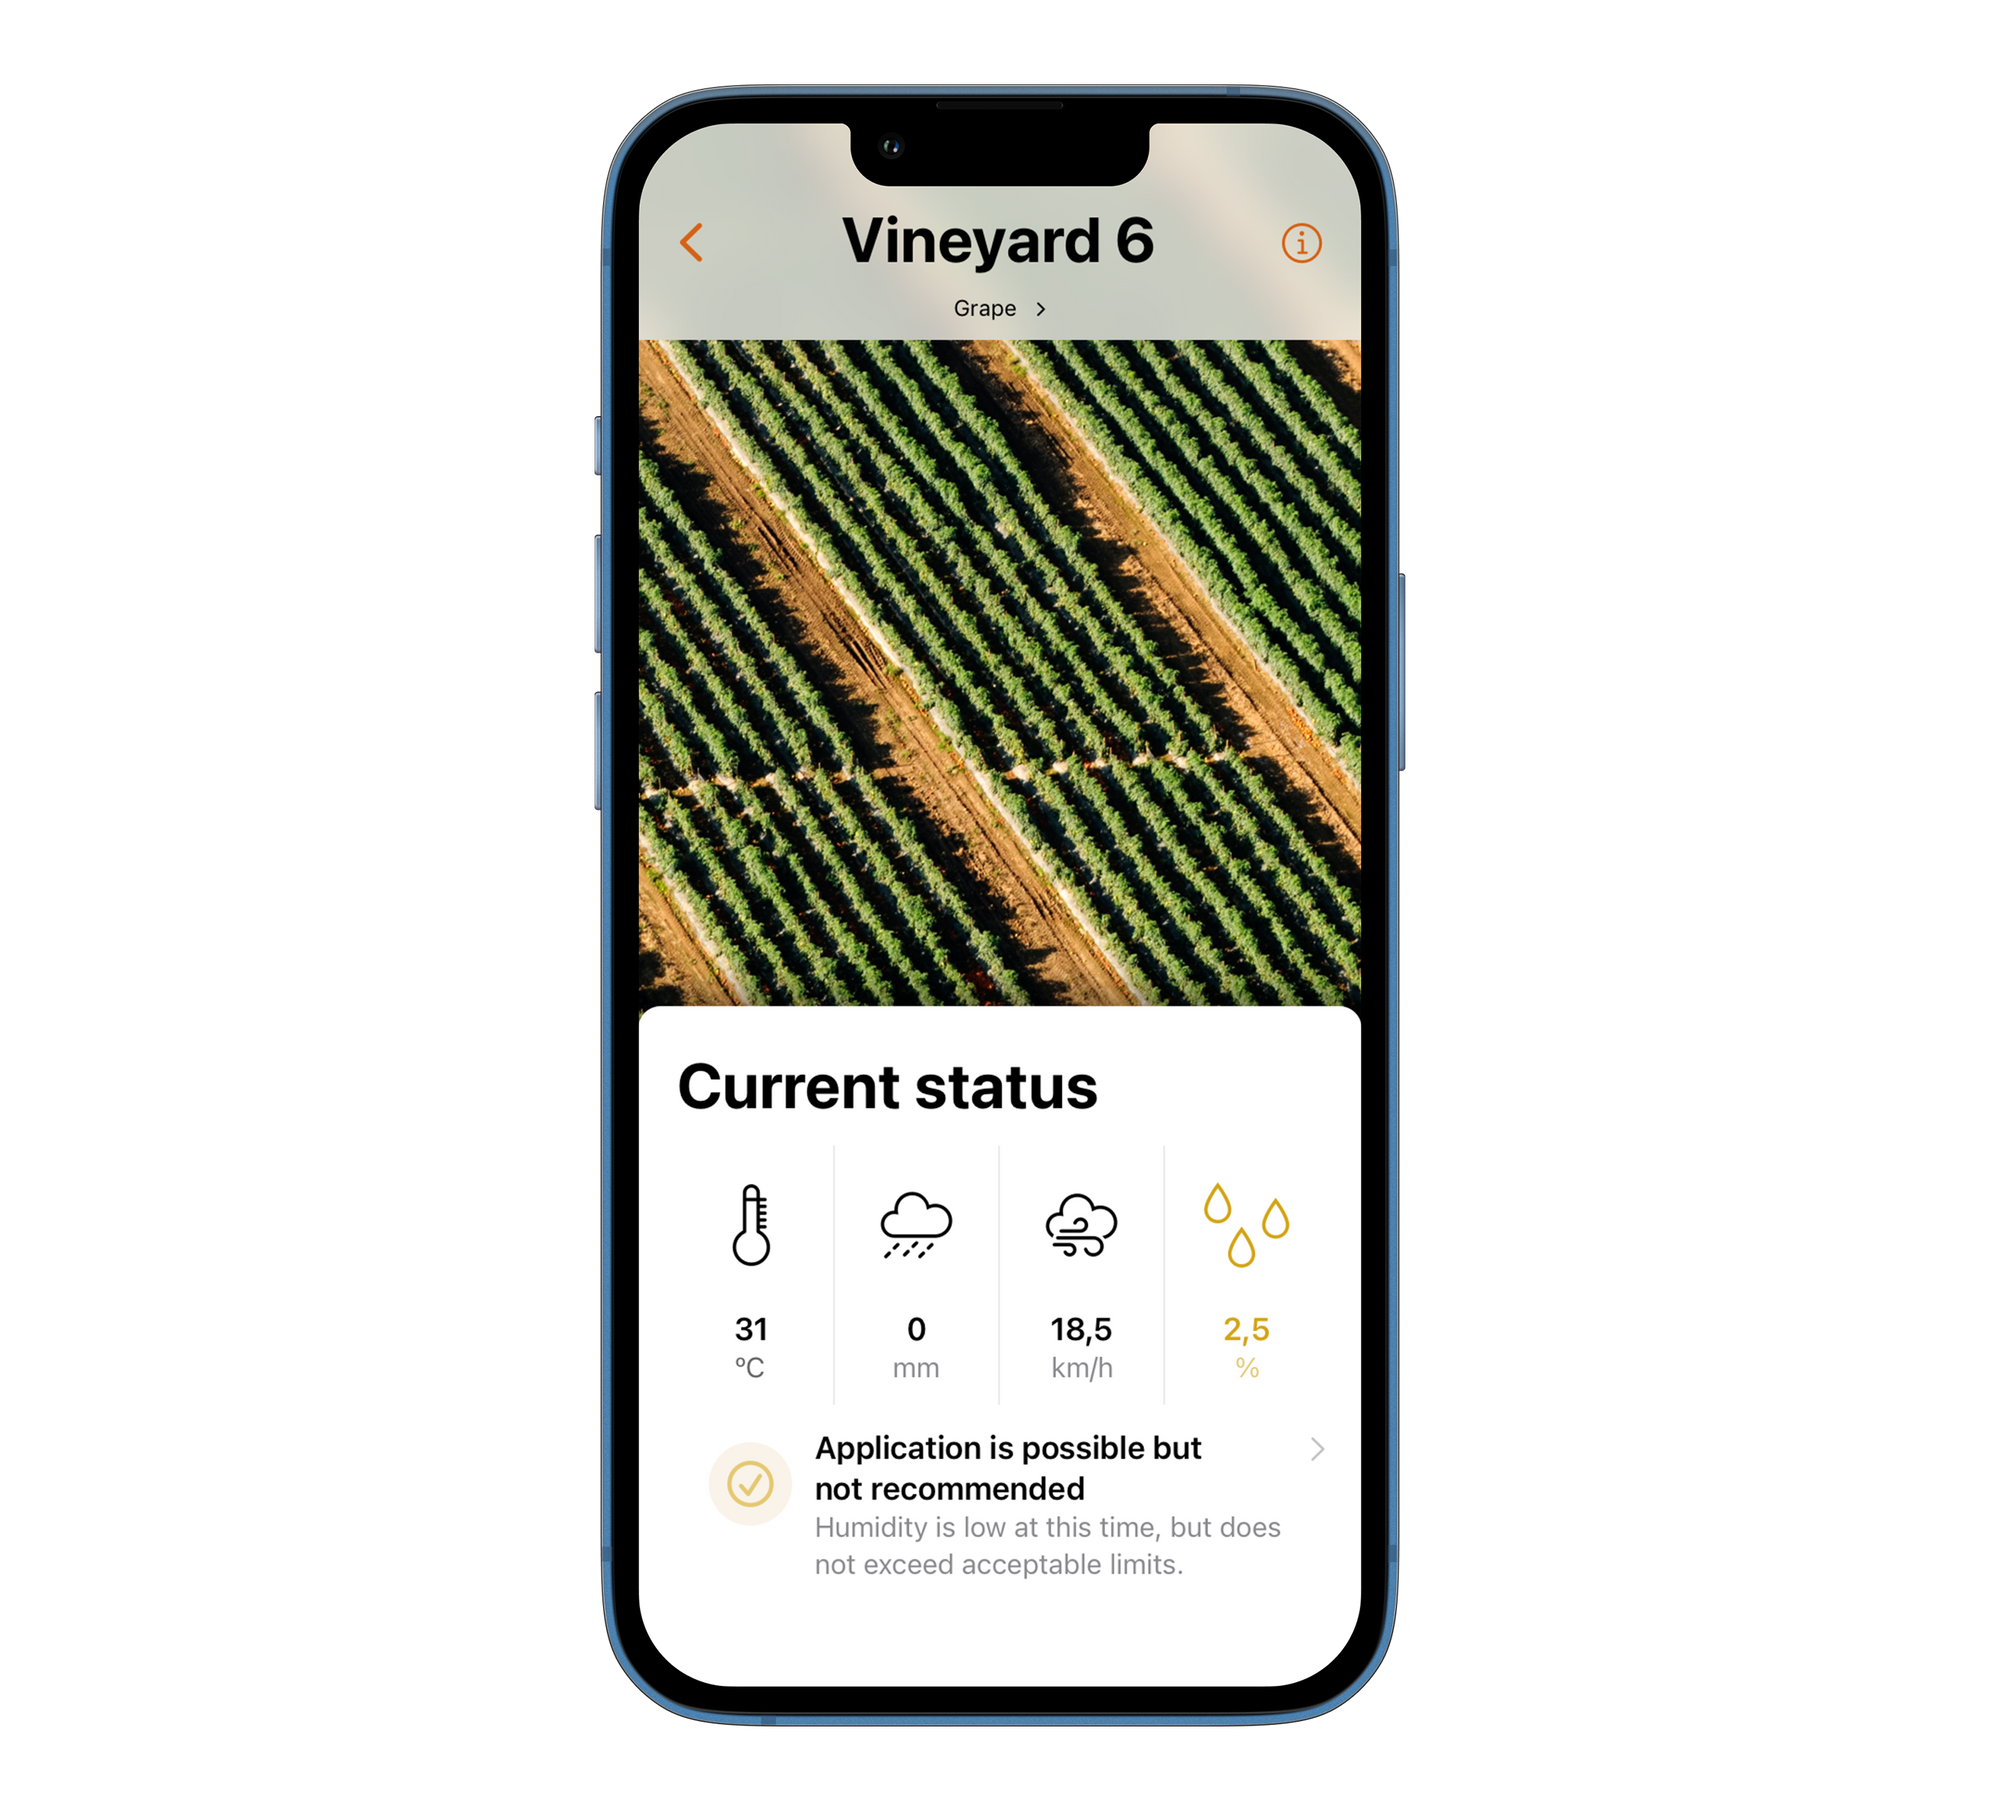
In addition, in some cases the data will not identify an extreme enough situation, and in those cases the application will communicate this in such a way, leaving the decision whether or not to process to the user's discretion.
Testing
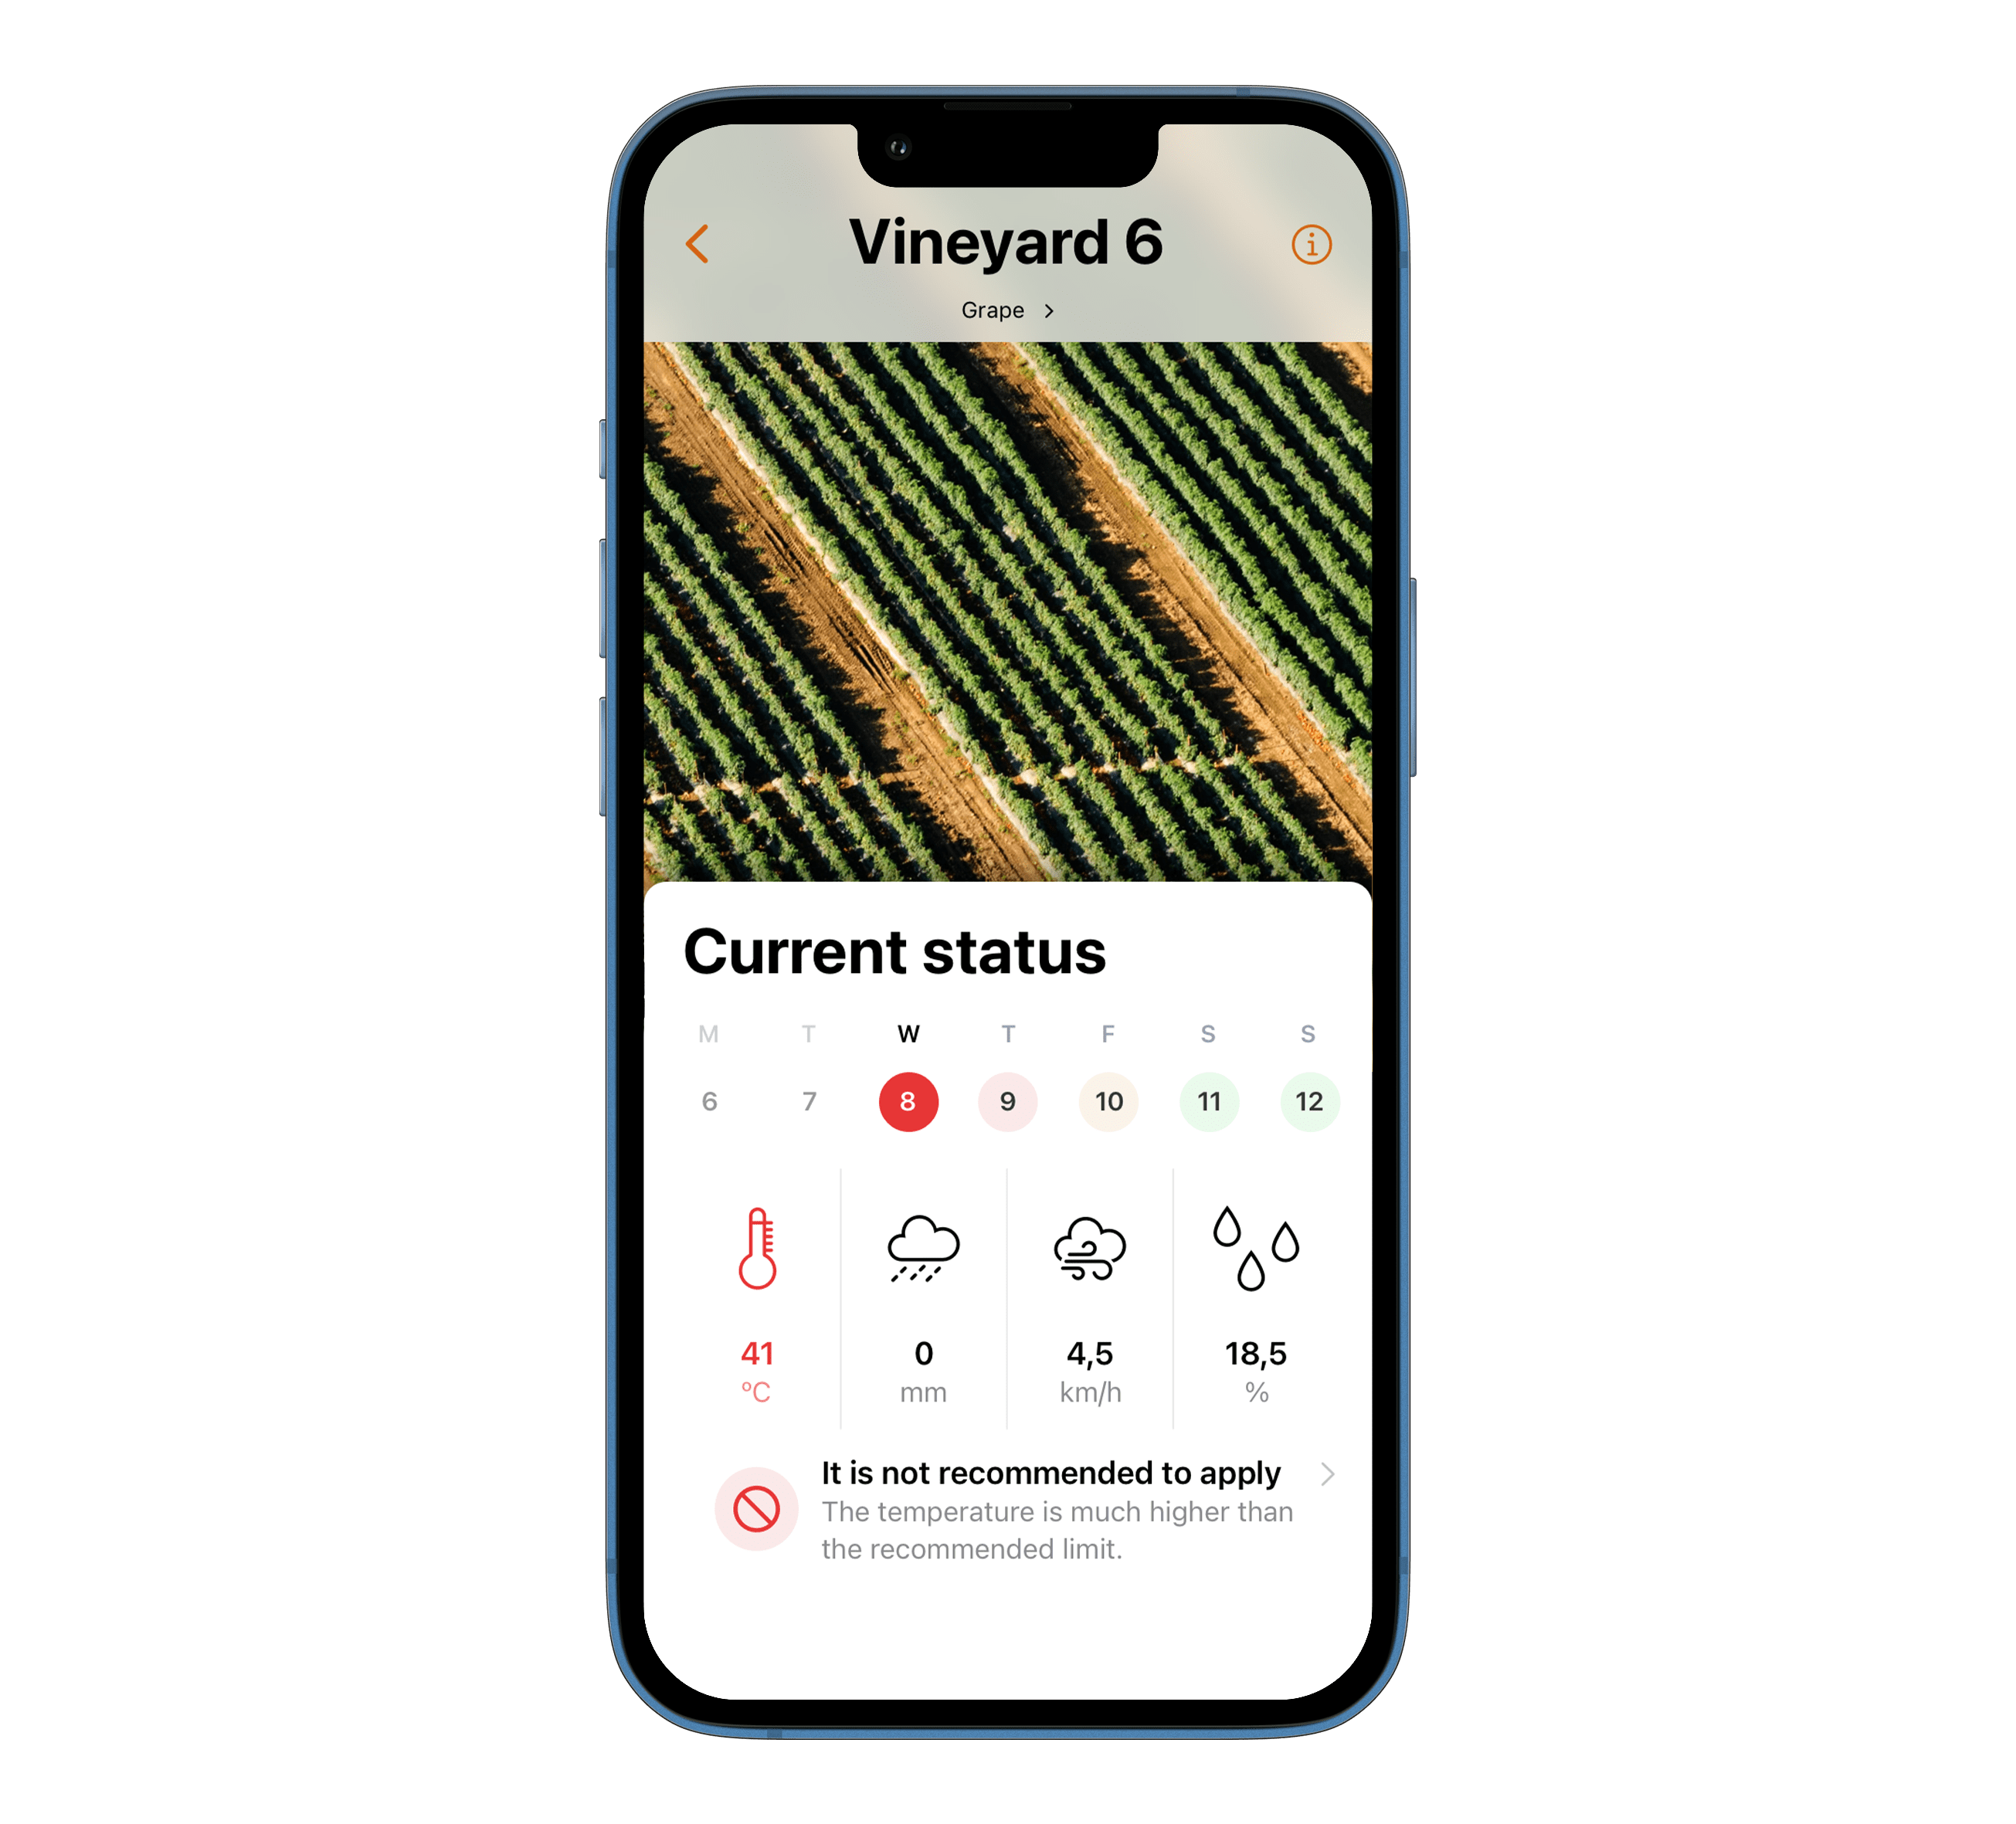
The evaluation sessions outcome was very positive and the help from our users was extremely valuable. In addition to confirming the suitability of our solution, they discovered the importance of being able to see also the weekly forecast and not only the current information, so that they could know, for example, whether or not it will be a good time to treat the plot in a few days' time.
We decided to use the feedback and the result was a complete but comprehensive and simple functionality that allowed farm workers and managers to know very precisely when and why it would be the ideal time to apply crop treatments to the field.
Results
Final solution
Thanks to the testing of the prototype and the feedback collected, we were able to implement the solution that our users needed, simple, accessible and useful.
As the application knows the type of crop in each plot, sometimes the recommendation will be different in neighbouring plots, as some crops tolerate certain conditions better than others. Knowing this information is useful for optimising treatments over time.
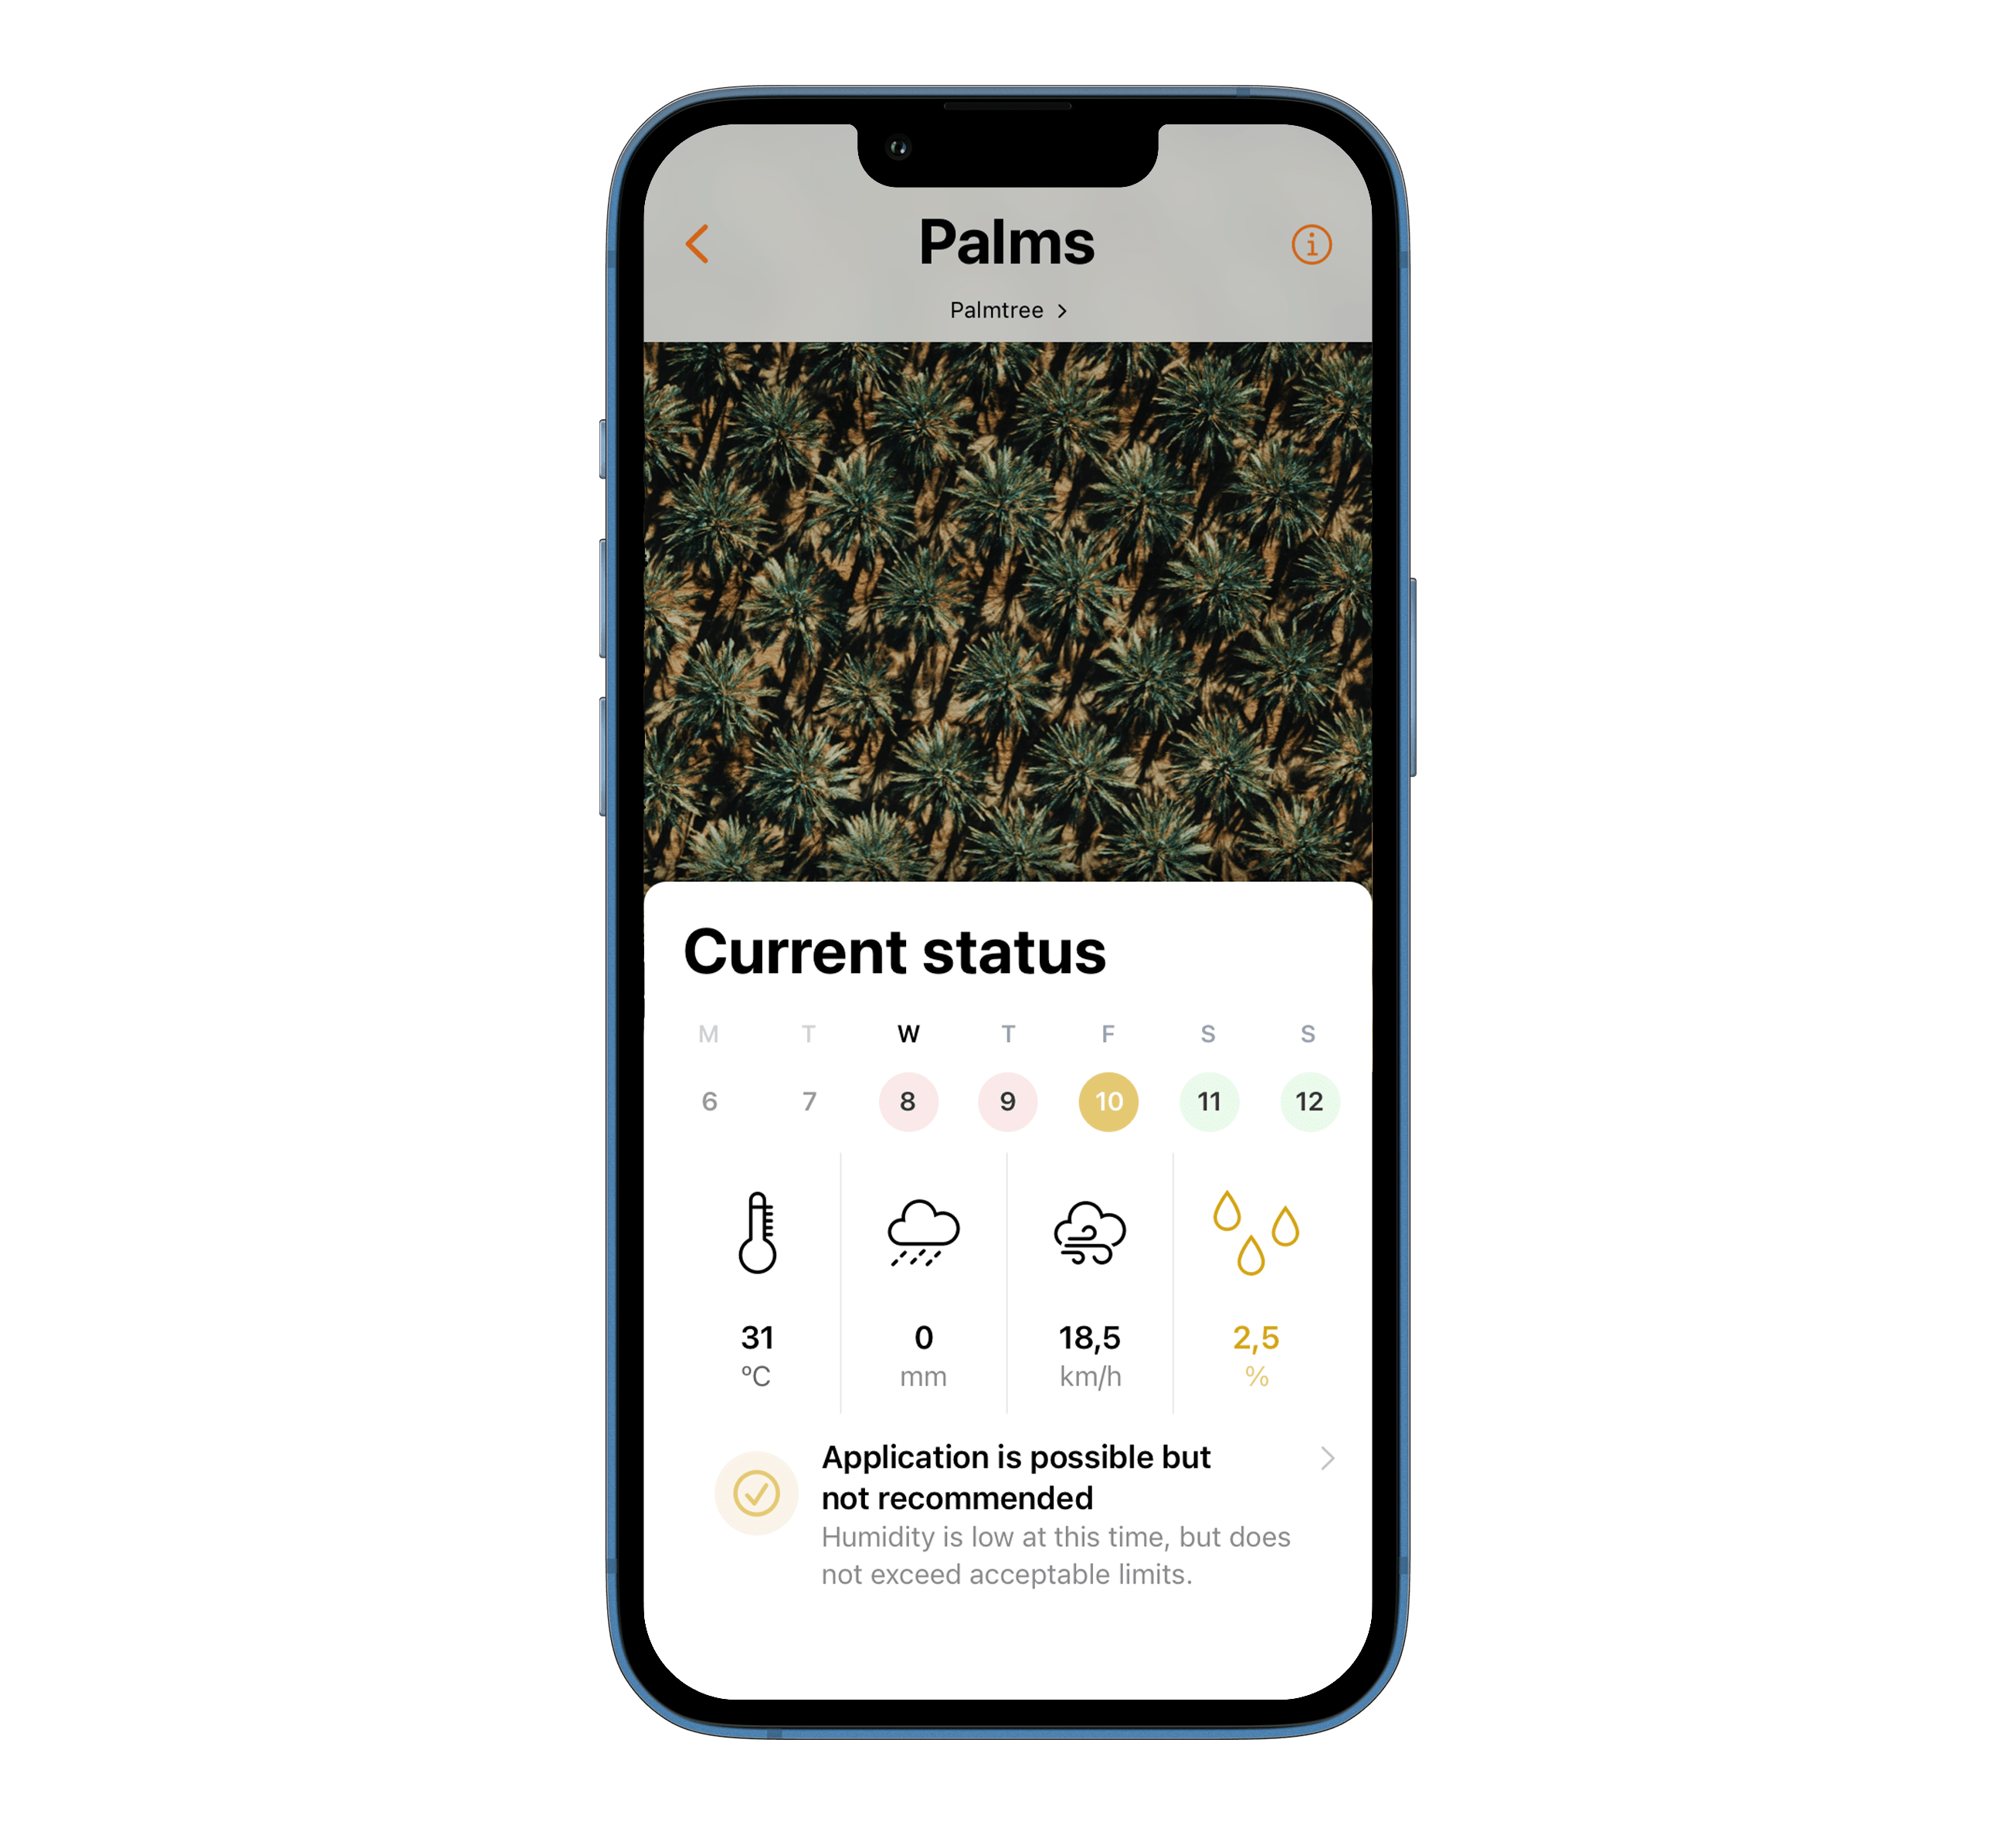
In addition, by having a relatively large forecast, the application of the relevant products between the plots can be optimally planned in unclear circumstances.
Result
Adoption of the new feature was widespread and incorporated into the regular workflow of most users, achieving not only time but also cost optimisations.
"With technology applied to the field we make more precise decisions."
Marta Aliño - Head of Agrarian Projects - Rústicas de l'Horta Nord
"Our customers are very versatile, they have fruit tree plantations, but also olive trees or vineyards. In this case, the platform makes it easier for us to have as much information as possible and to use the most responsible phytosanitary products."
Enrique Llopis - Technical Agricultural Engineer in Insecticides and Fertilizers - Llopis y Llopis
Plans for the future
Looking to the future, the roadmap seeks to use neural networks to improve prediction and learning so that recommendations are increasingly more precise and relevant, suggesting ideal times throughout the month or even the year.
In addition, by having an increasingly large knowledge base, the information accumulated from the total number of plots can be useful for other users' plots.
Eventually, the ultimate goal is the convergence between mobile and desktop applications (webapp), so we are aiming for a future in which any management can be done comfortably and efficiently from any of the available platforms, further bridging the possible barriers between the different profiles of agricultural workers, something in which Visual has already achieved incredible results.