The Problem
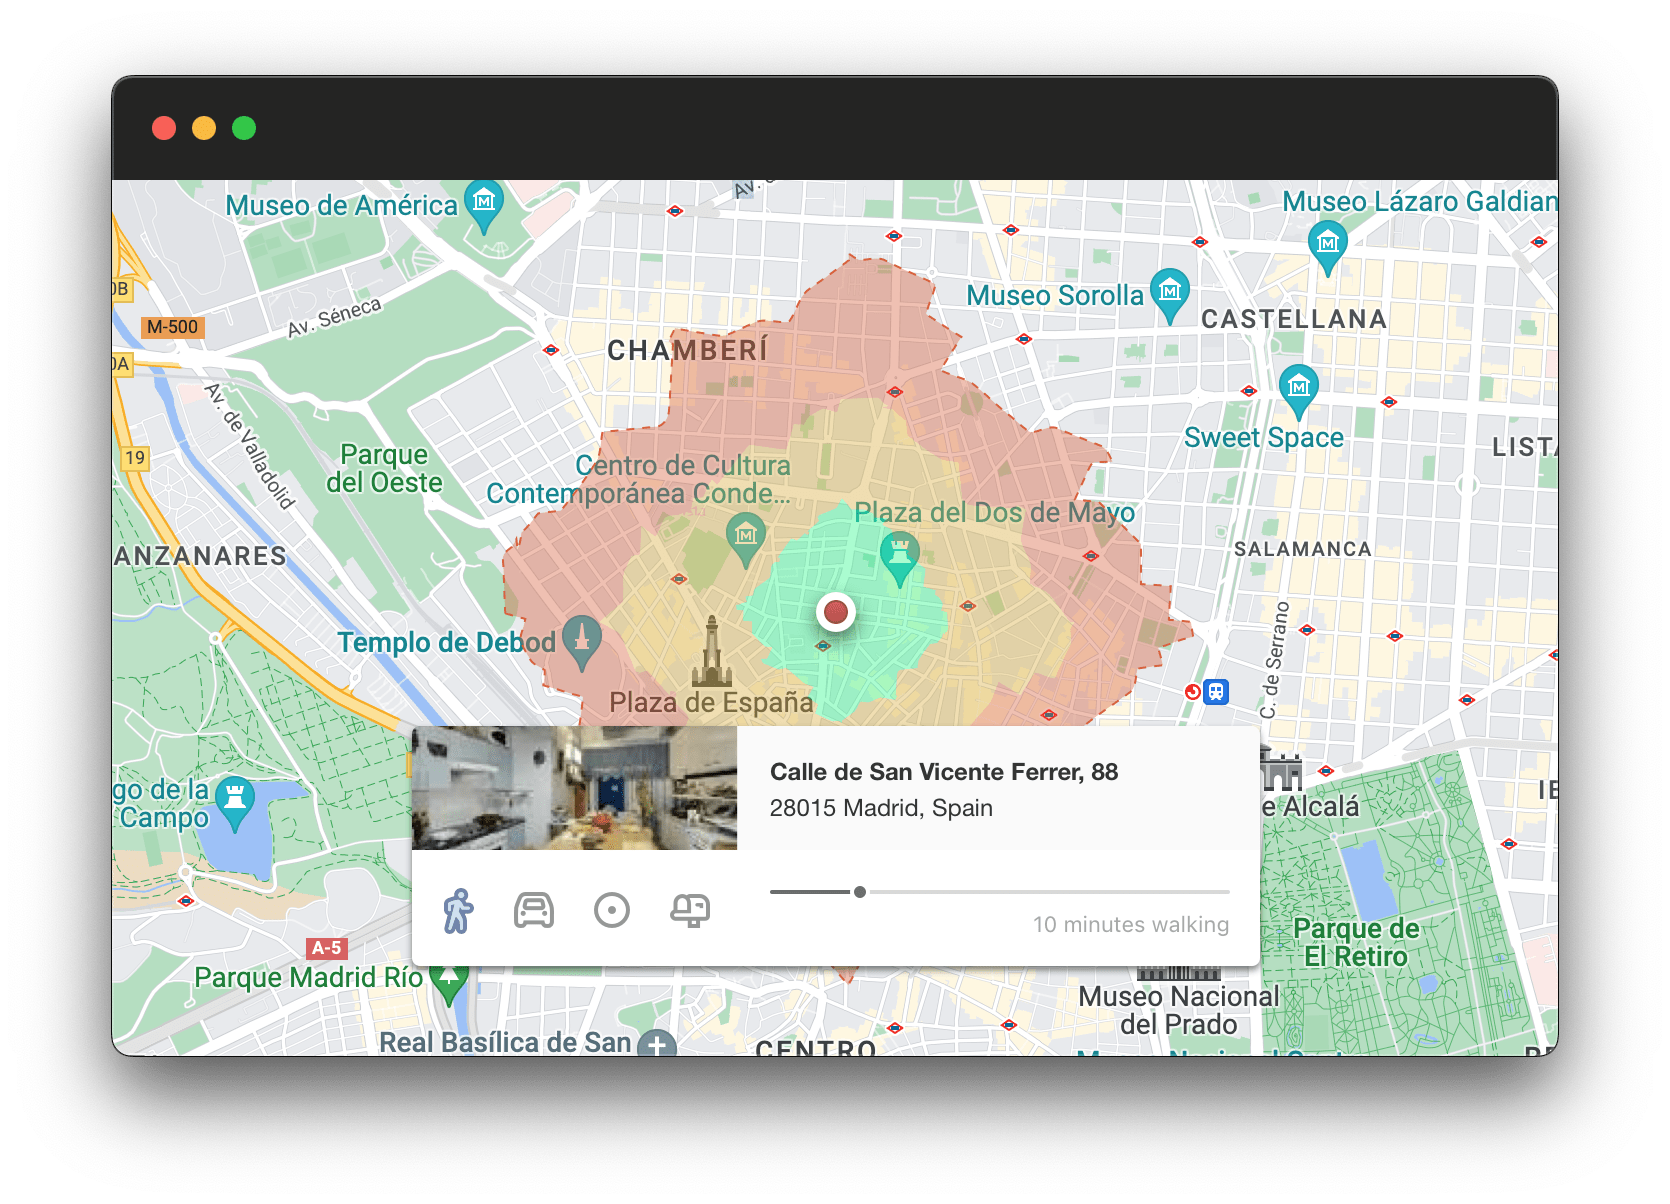
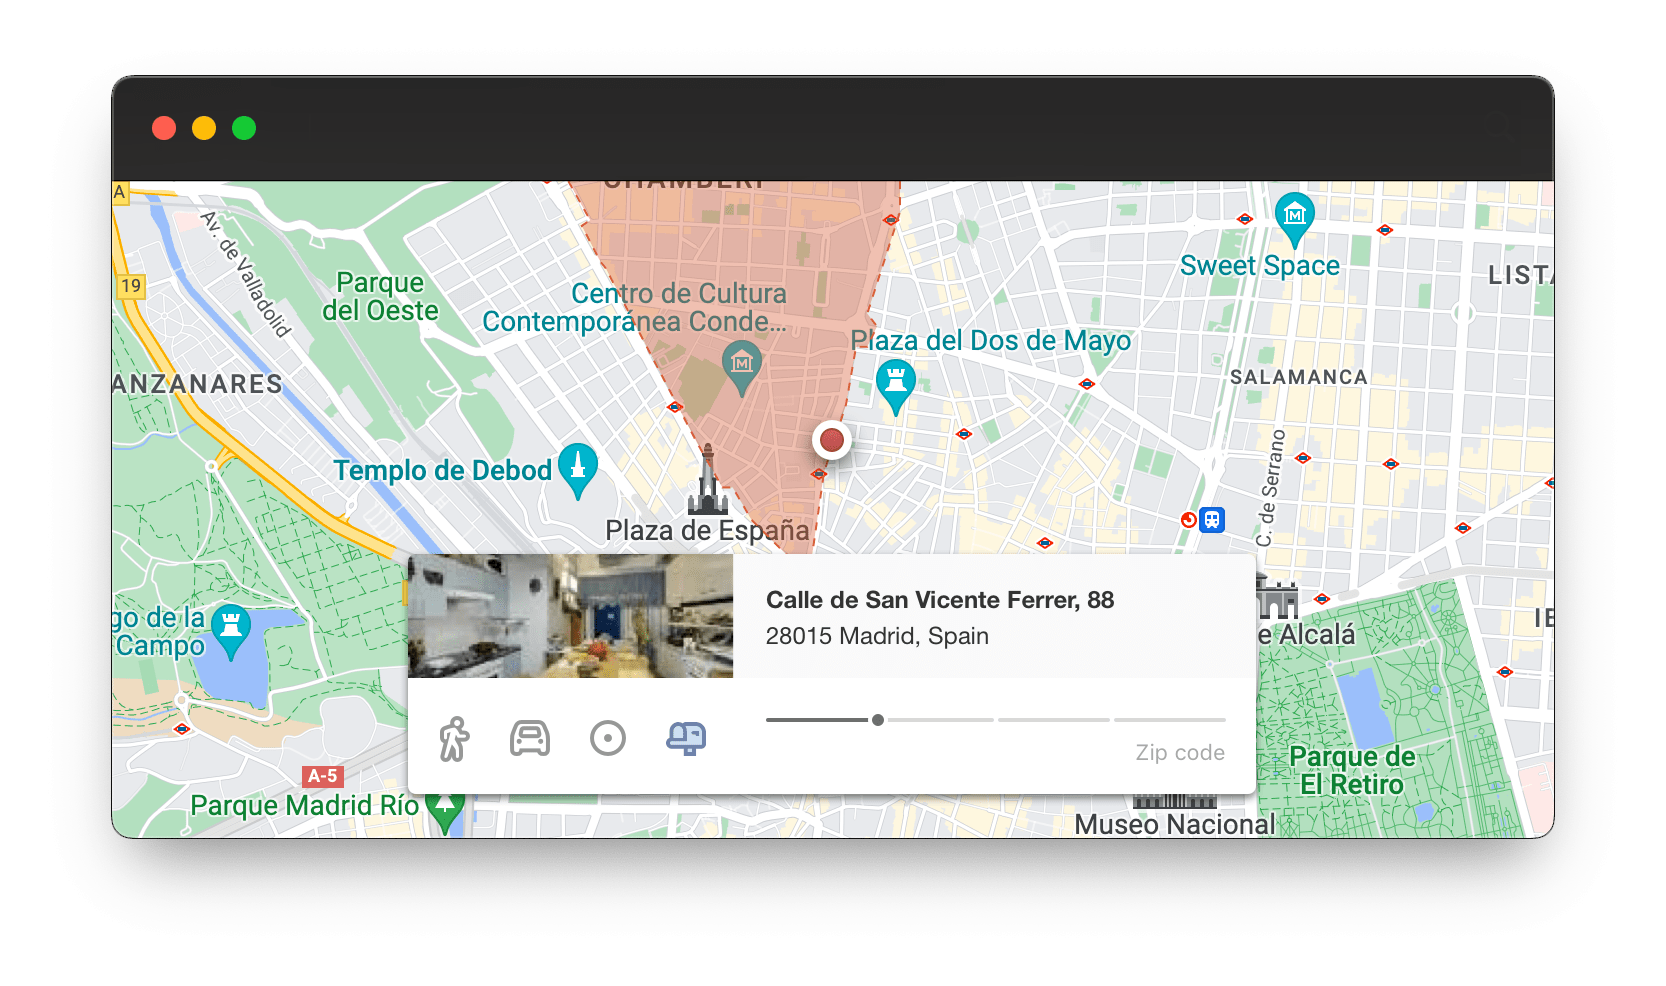
Geoblink is a business intelligence platform focused on geographic data analysis. It allows businesses to obtain relevant and accurate information on areas and population groups of interest. The core interface centers on an interactive map where users perform operations — analyzing areas, exploring points of interest — with a side panel displaying reports.
One of the most common user flows was creating a catchment area: defining a space on the map for the application to generate an automatic report. Our metrics and user feedback revealed the same thing — this critical flow was complex, sub-optimal, and incorporated more friction than acceptable for something users did dozens of times per day.
The existing flows
The original feature supported three area types, each requiring multiple steps:
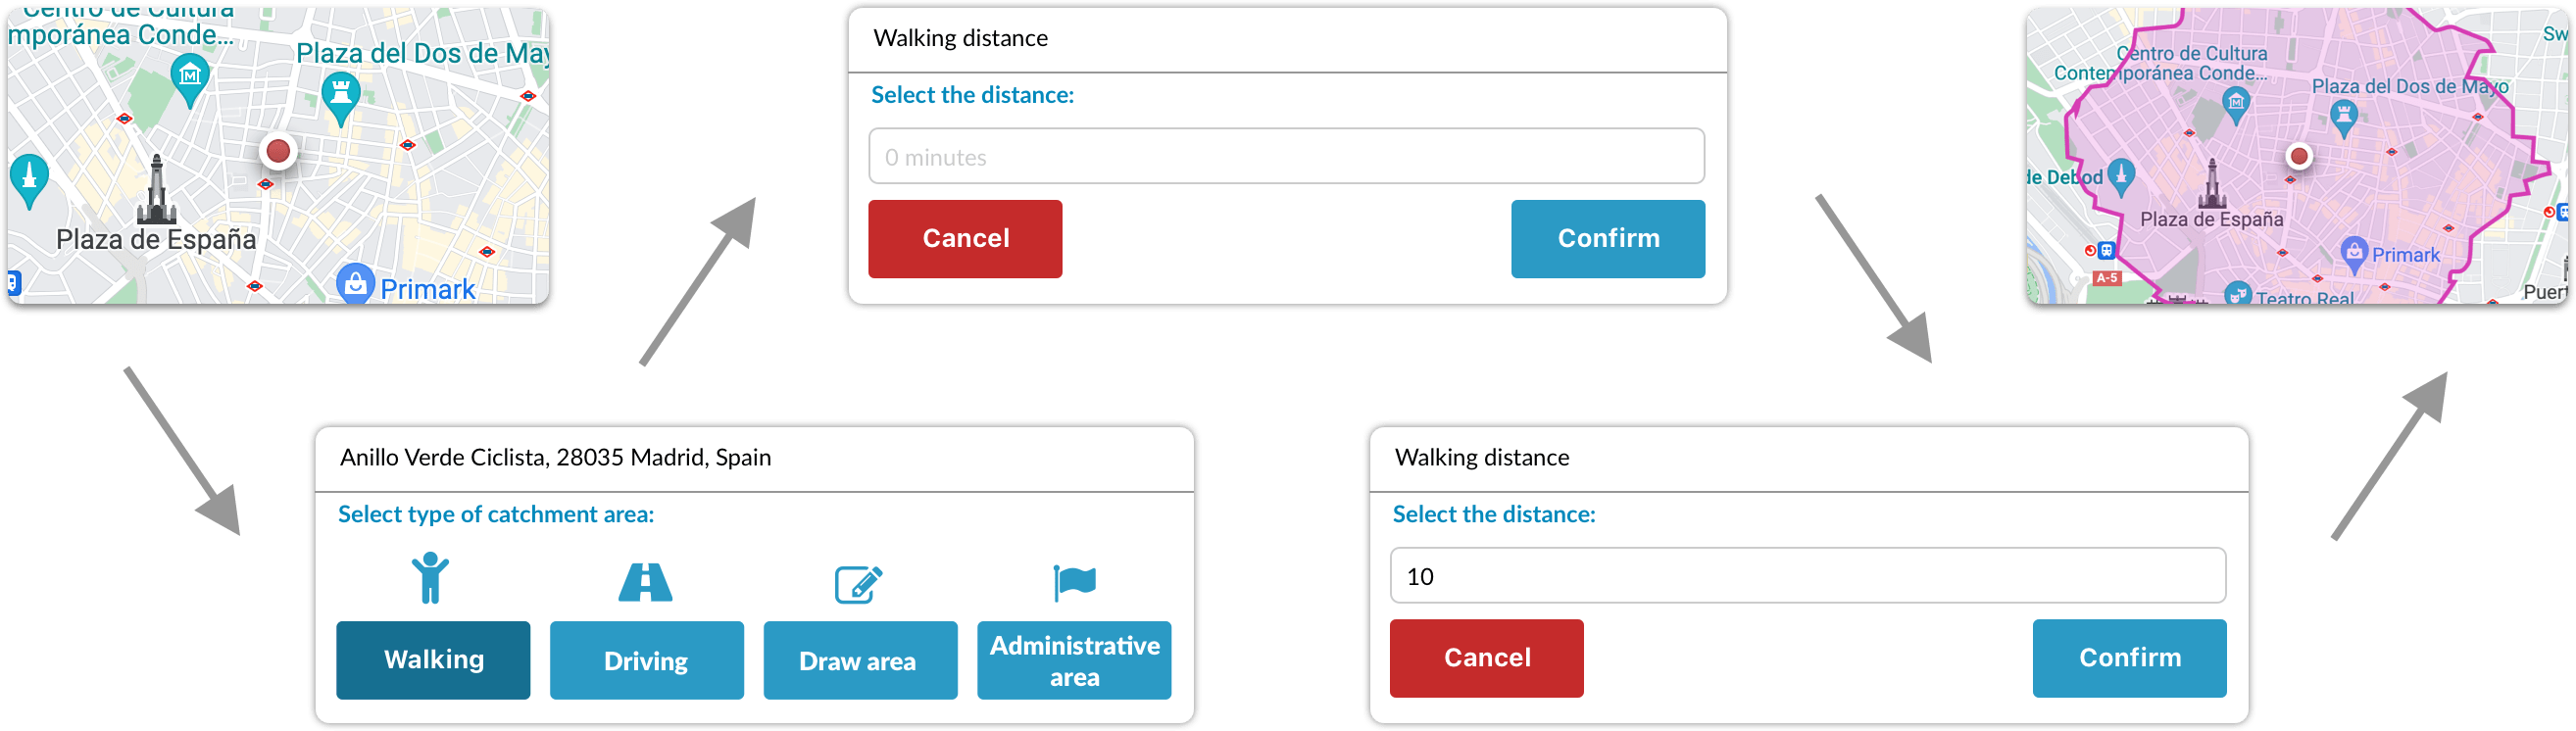
Walking or driving time: Click a point on the map, select the distance type, type a numeric value into a text field, then confirm. At minimum: 3 clicks and keyboard input.
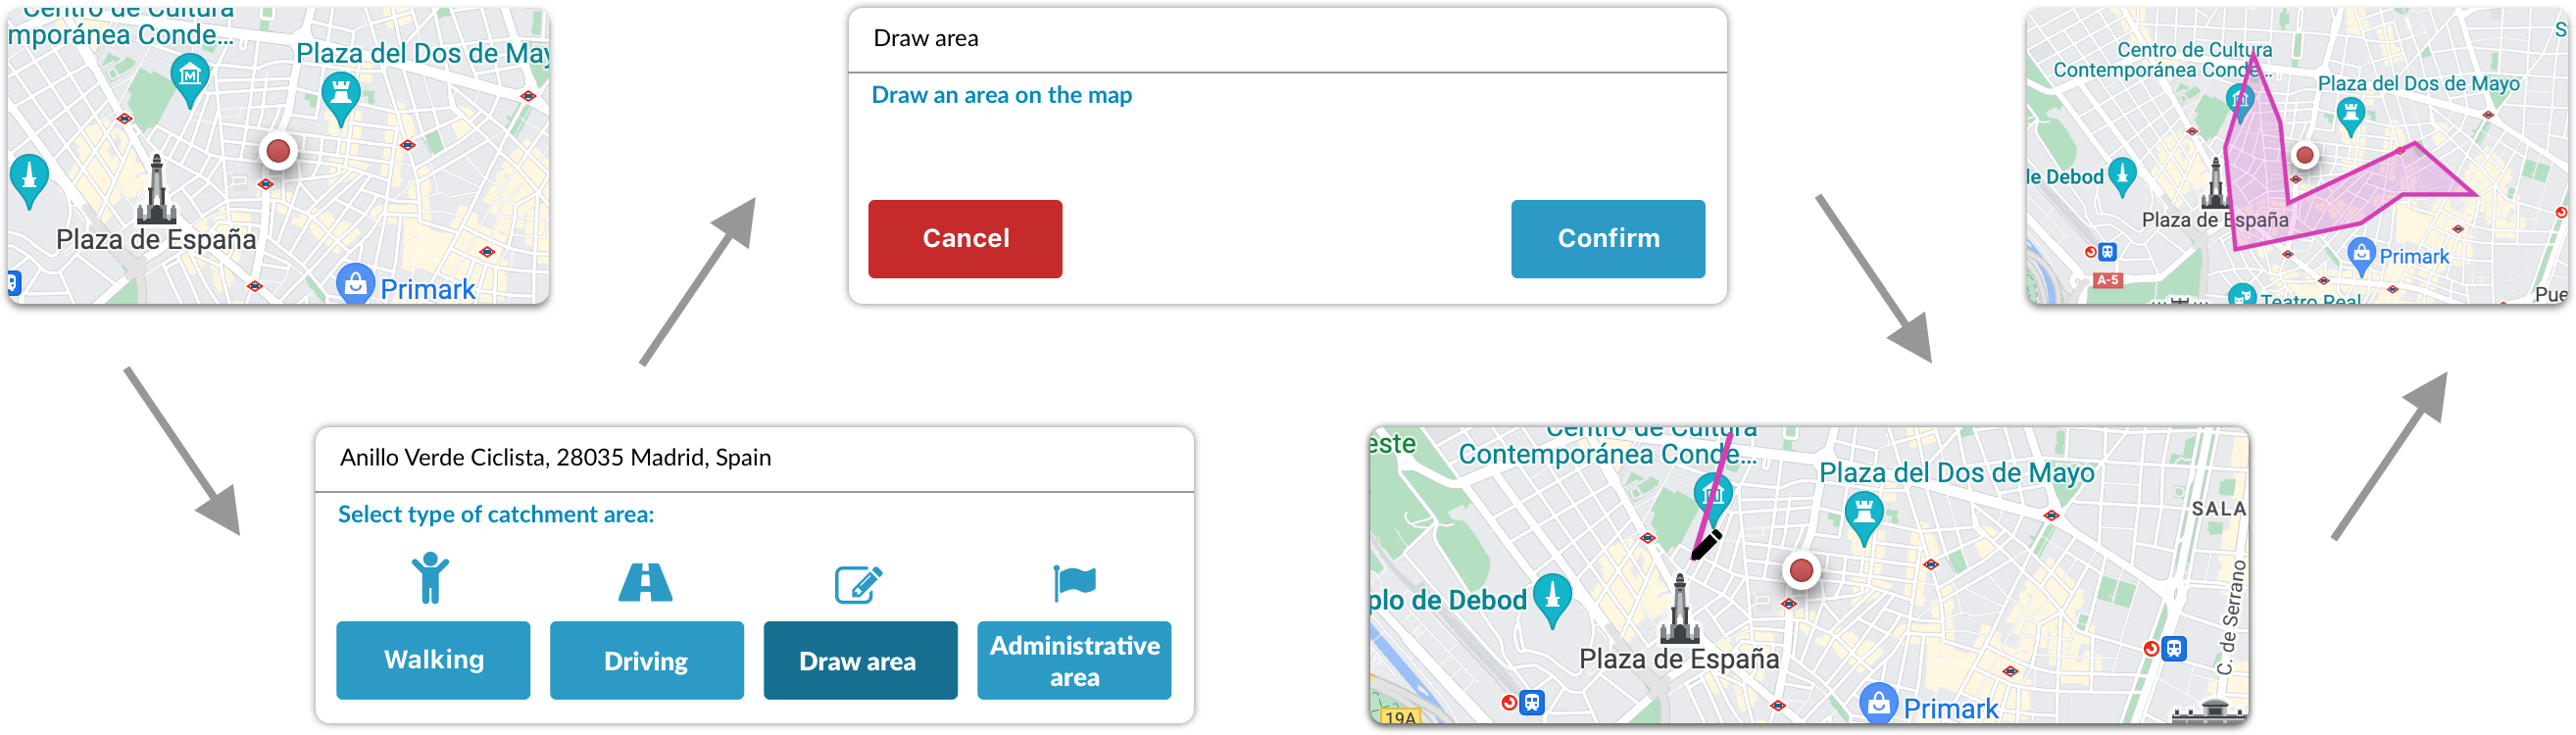
Free drawing: Click a point, select draw mode, manually click vertices of a polygon on the map, then confirm.
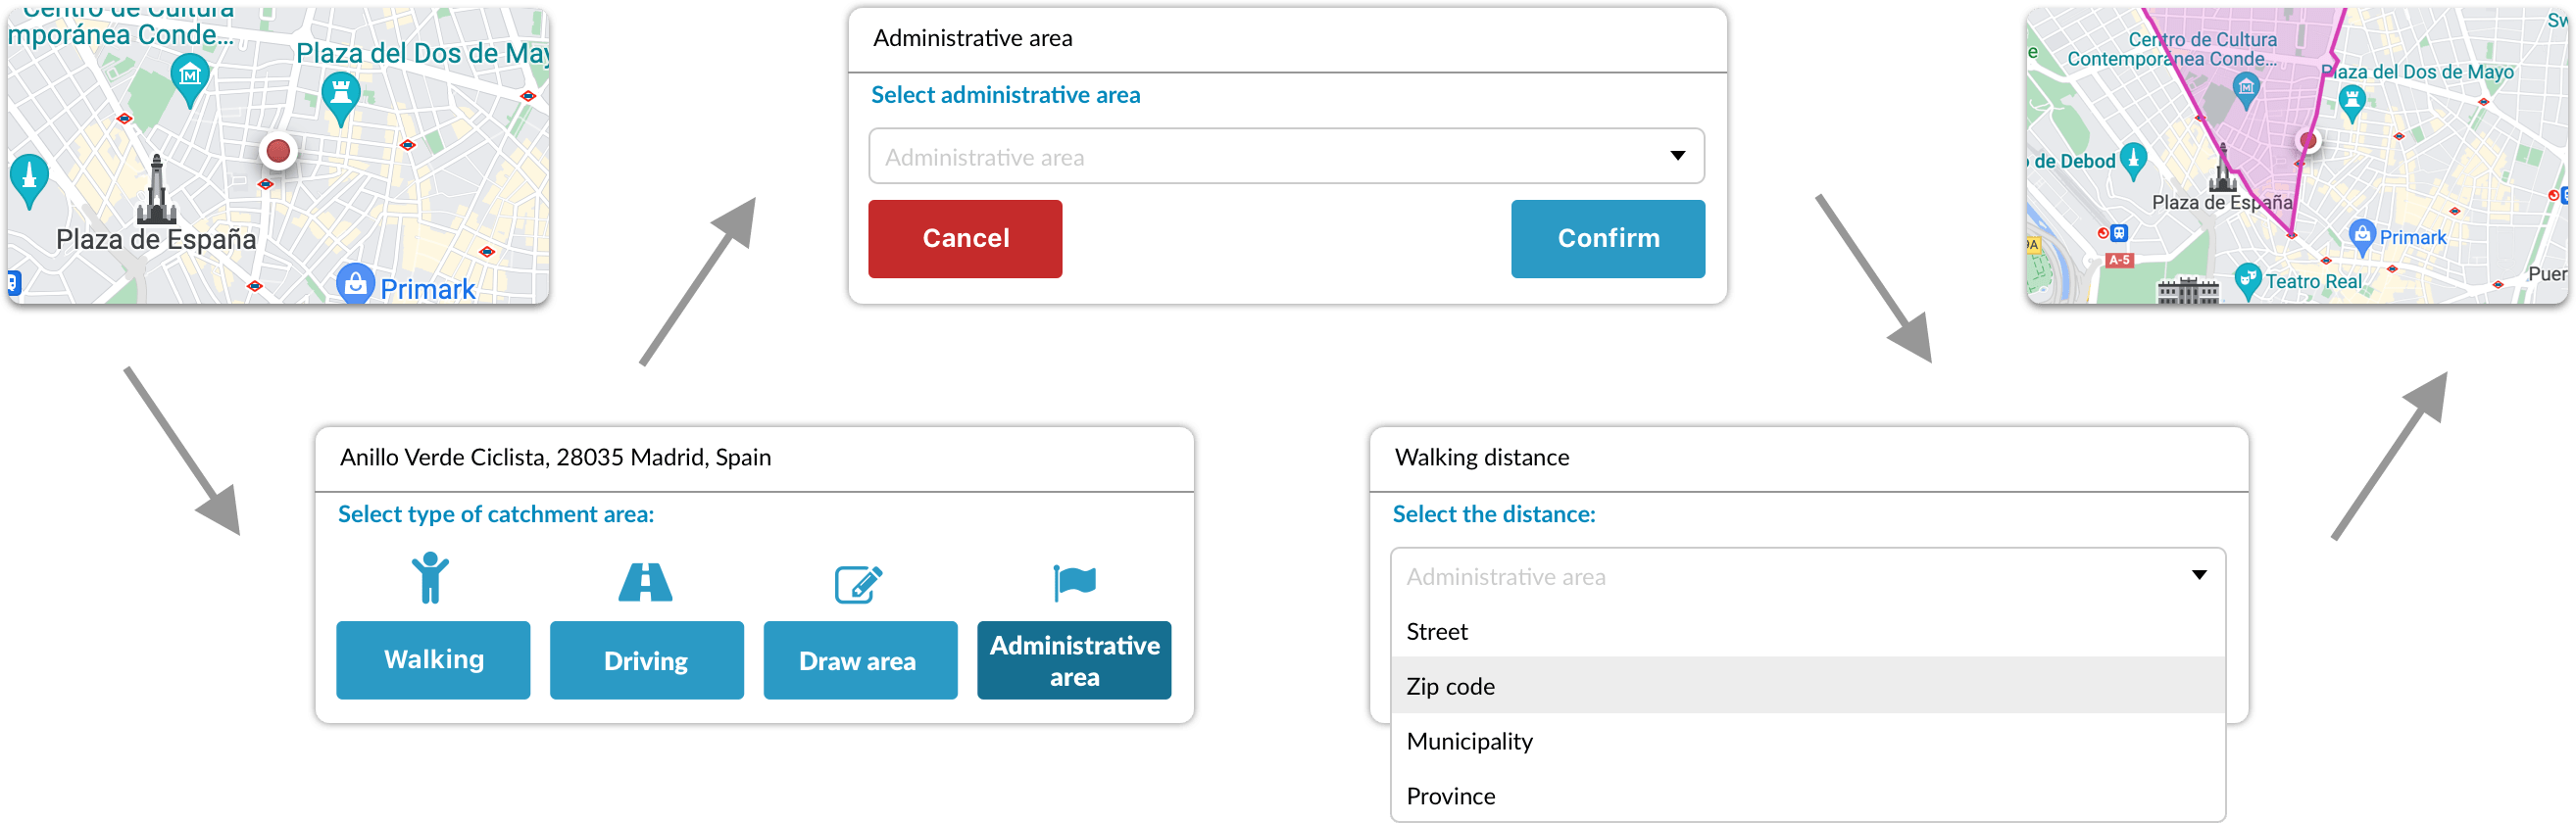
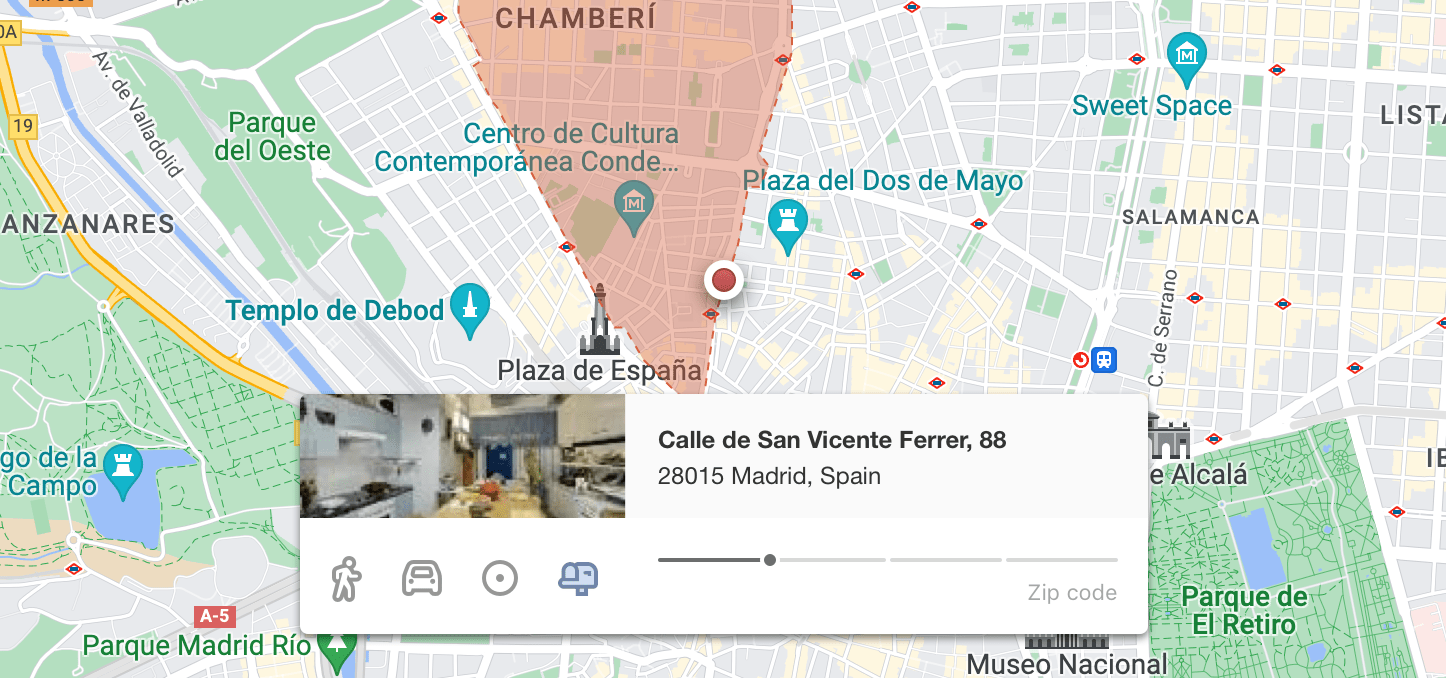
Administrative area: Click a point, select administrative area, choose from a dropdown (road, postcode, municipality, or province), then confirm.
Research & Insights
Our metrics showed that creating catchment areas was one of the most frequent user flows in the product — particularly the "10-minute walking radius." I built a research plan around four questions:
What is the purpose of creating catchment areas?
What information is most relevant when creating a catchment area?
Do users understand how to effectively create catchment areas?
Do users know how to interpret the resulting information?
I focused on three methodologies: market research to understand competing solutions, generalized surveys across our user base, and face-to-face usability sessions with satisfied customers and those with criticisms — reducing bias in the analysis.
Key findings
The most common catchment area was the "10-minute walk." Users created this area type far more than any other.
Several users had stopped using the feature entirely because they found it complex and slow.
The lack of real-time feedback left users unsure whether the system was processing their request or had failed.
Most users found the flow slow and repetitive. They wanted it to be more streamlined.
Design Process
From these findings, I started working with two clear intentions: transform the feature to be as simple, efficient, and user-friendly as possible and use this redesign to take the first step in building Geoblink's new design language.
I sketched different approaches to eliminate unnecessary clicks, provide instant feedback, and make the flow as clear and unambiguous as possible.
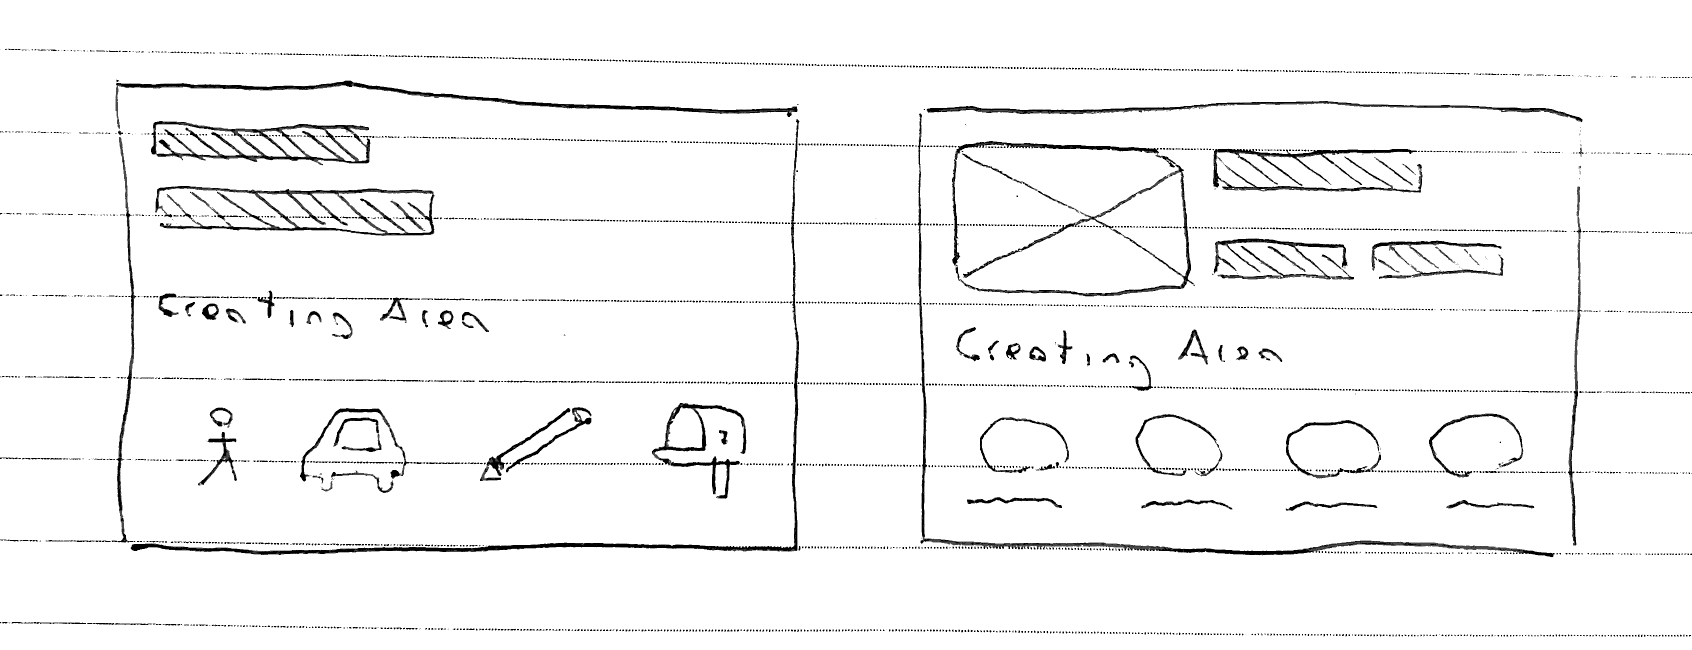
One of the first explorations was replacing the old generic icons from an icon bank with custom icons designed specifically for this feature. I also observed that the "paint area" option was difficult to justify in a popup triggered by clicking a specific address, so I moved this option to a separate section.
Taking into account both usage metrics and research findings, I combined two principles: reducing friction (eliminating unnecessary steps, using default states matching the most common parameters) and improving communication (providing real-time feedback from the first click).
The proposed redesign reduced friction significantly: from 3 clicks and several keystrokes for the most common catchment area (10-minute walk) to 1 click and zero keystrokes.
Testing & Iteration
I converted sketches to high fidelity early and tested with customers both in person and asynchronously. The results were extremely satisfactory.
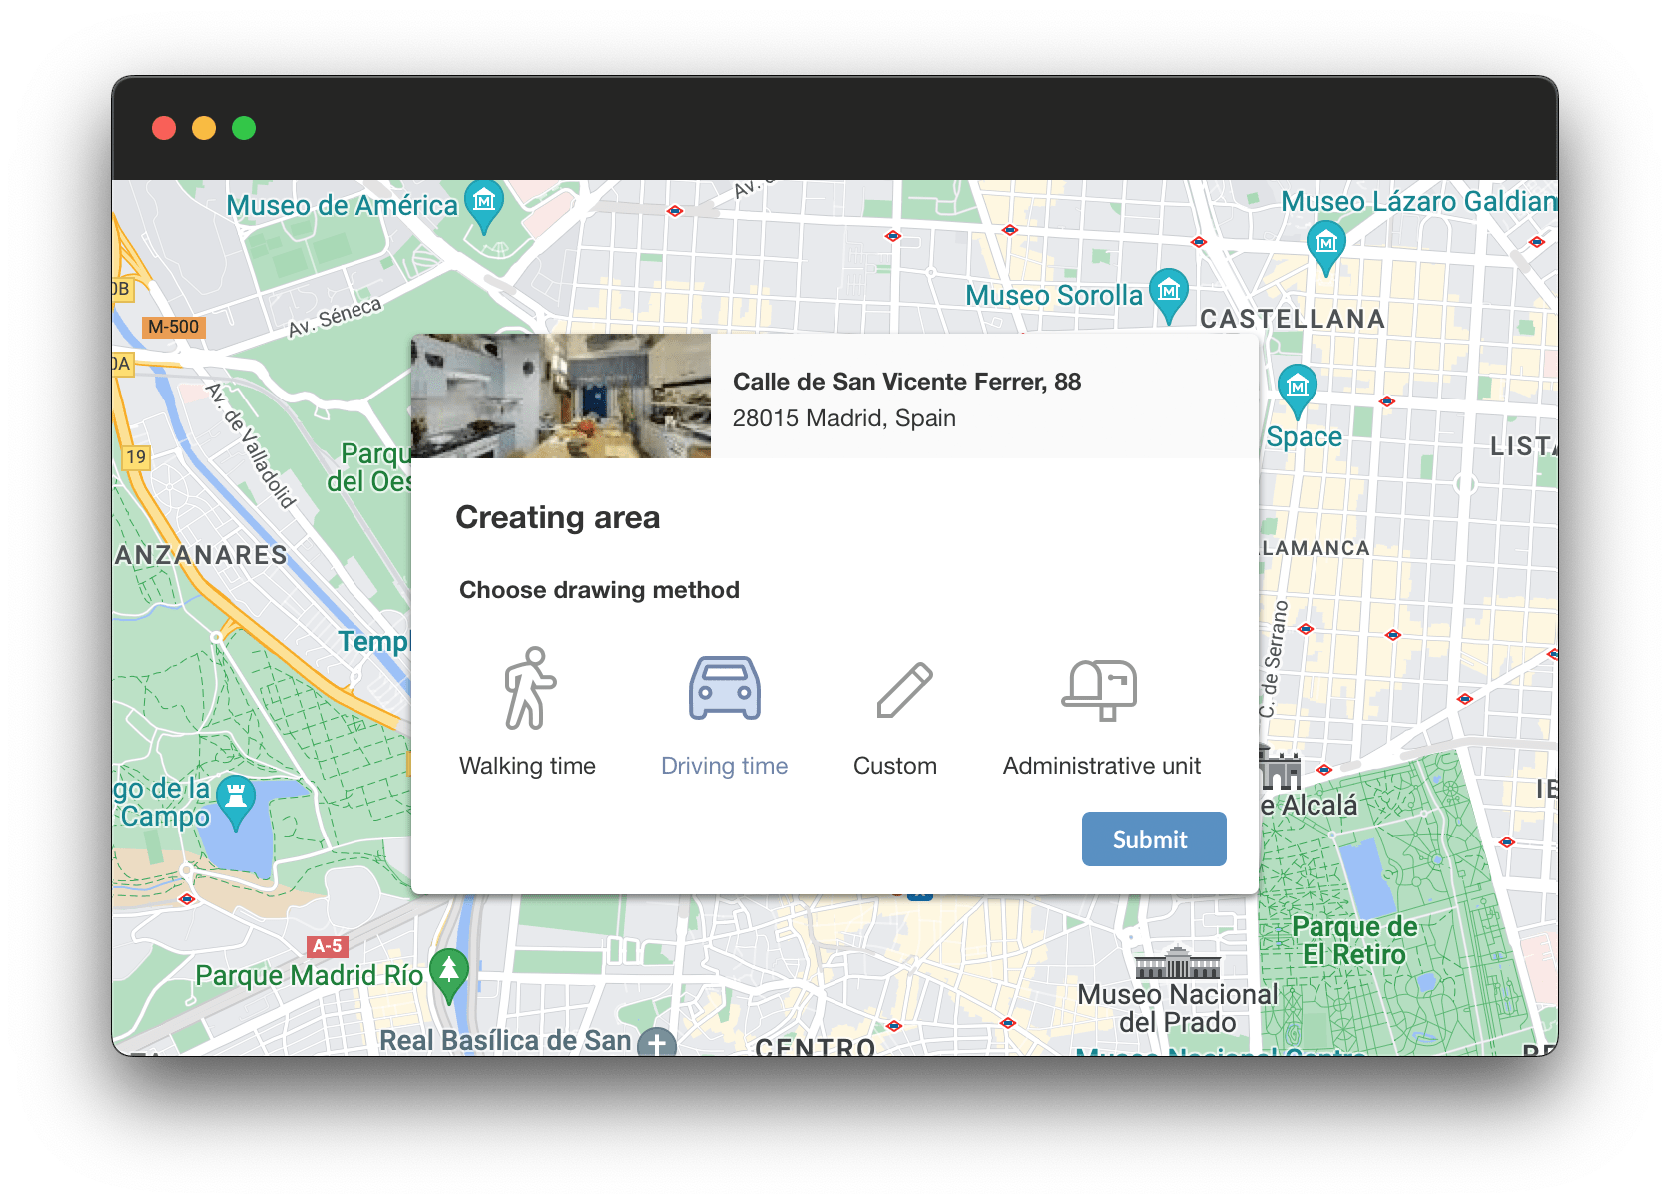
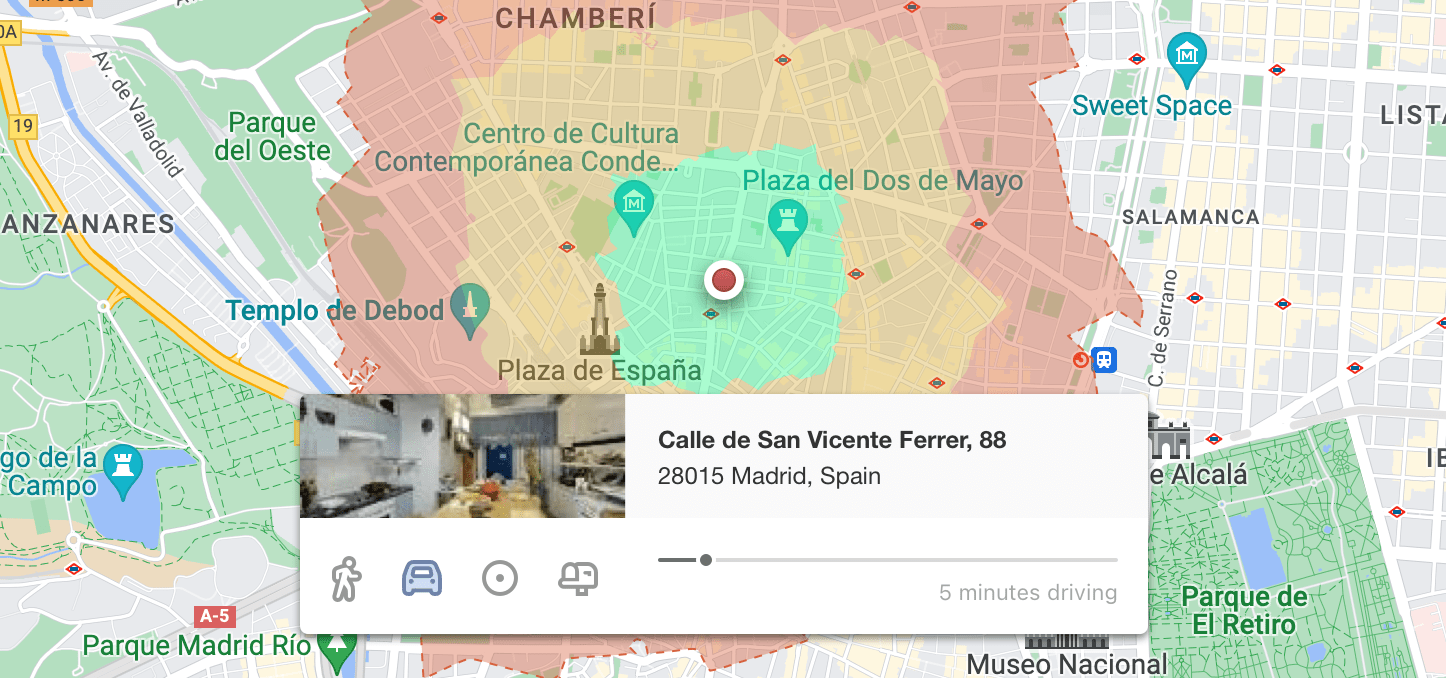
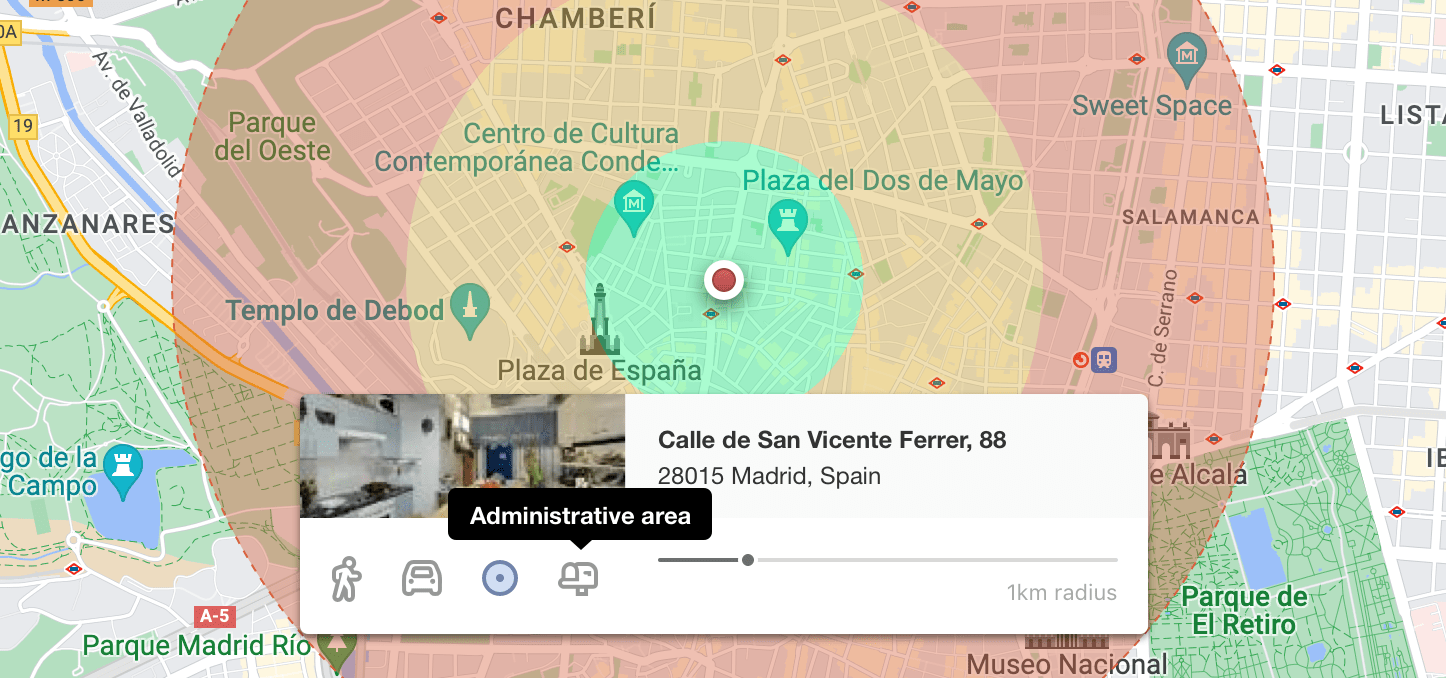
Users were instrumental in refining the iconography. Through testing, I concluded that the best icons for each area type would be: a pedestrian for walking distance, a car for driving distance, a circumference with a visual center for radial area, and a mailbox for administrative area — replacing the old generic pedestrian, road, pencil, and flag icons.
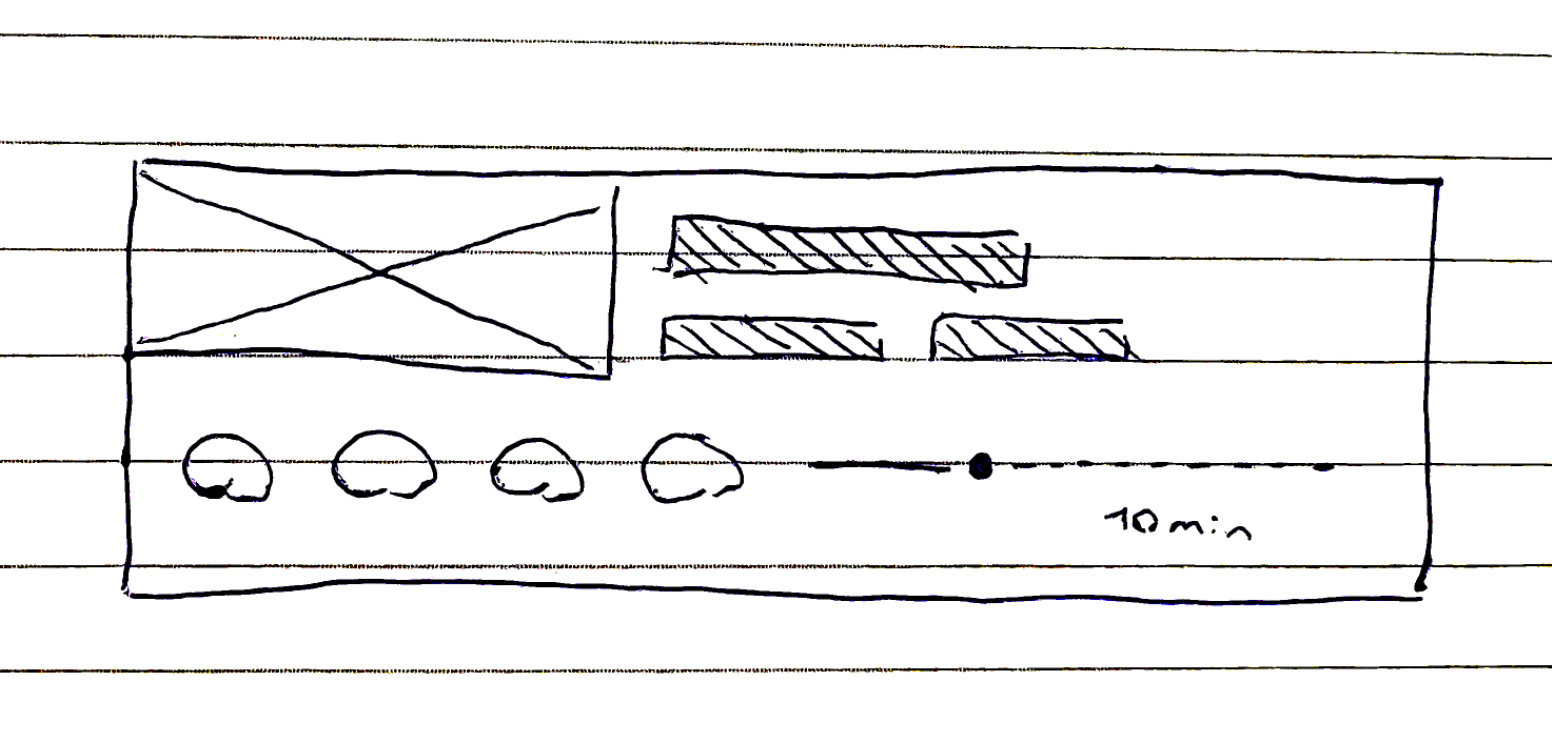
I also refined the administrative area selector so that the slider provided discrete visual feedback — each position clearly corresponding to a specific administrative level.
The reception of all changes was unanimously positive — and in some cases exceeded expectations.
Final Solution
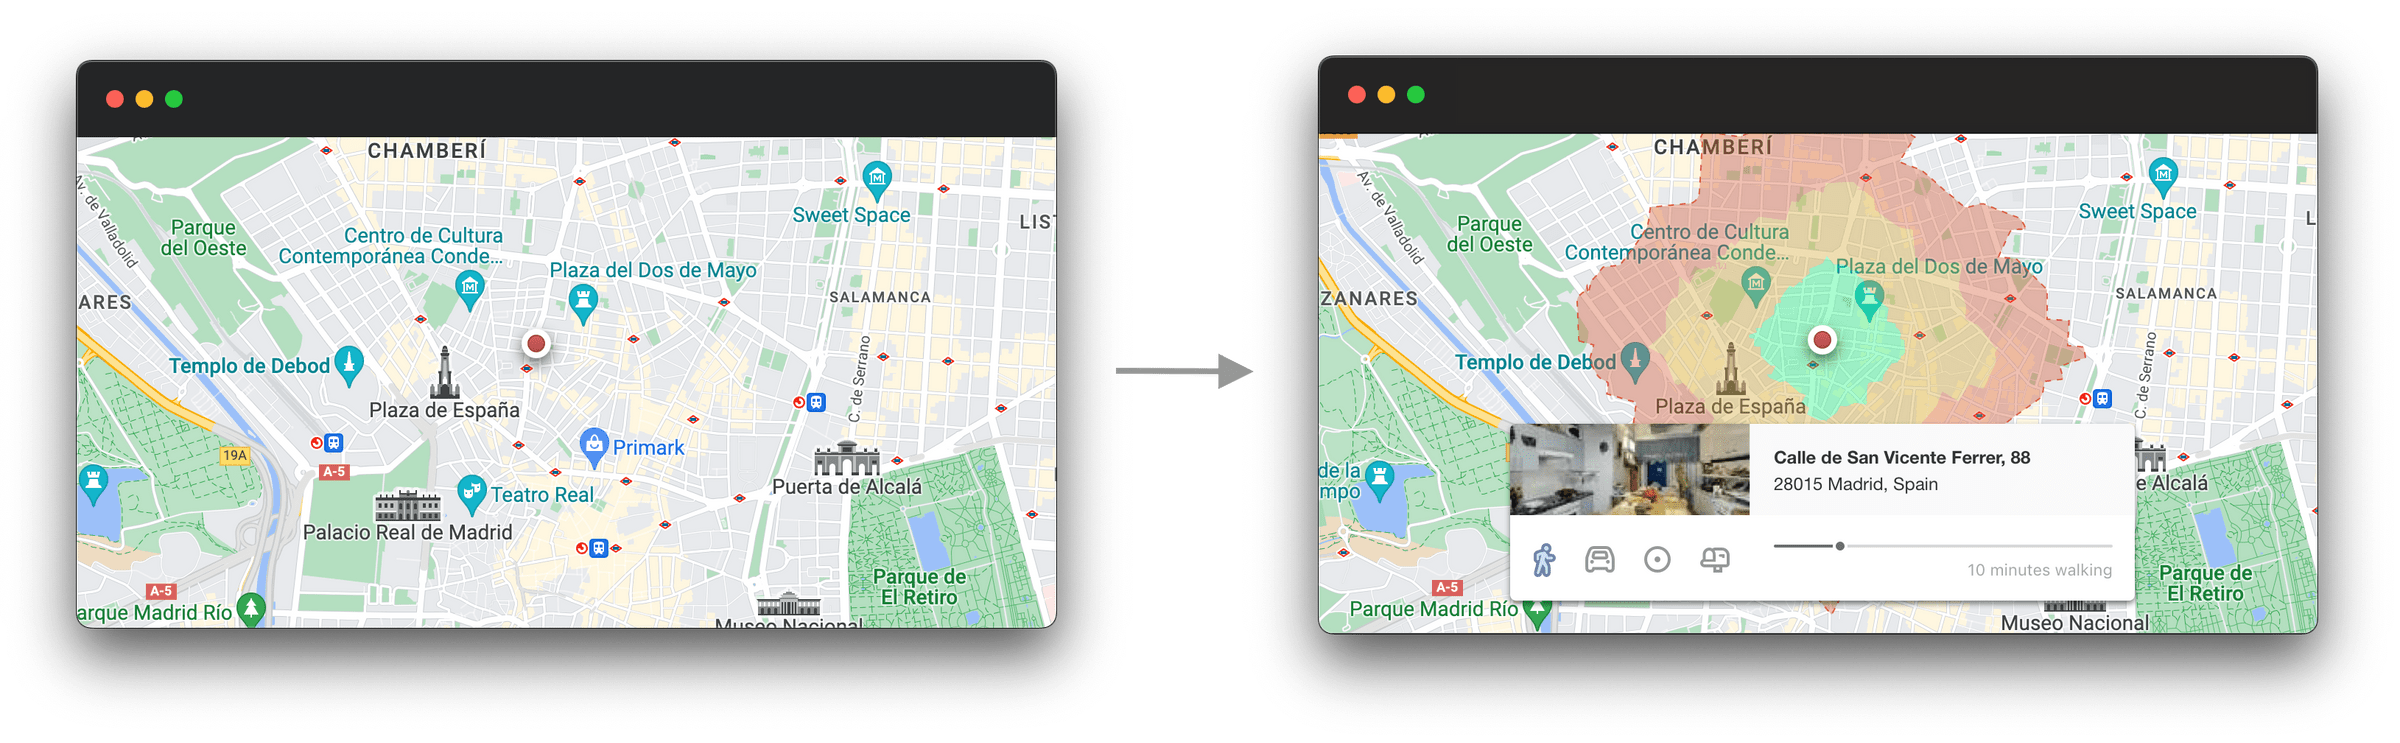
The final design was a complete visual and functional redesign of the catchment area creation feature. The new flow used default states immediately upon invocation to reduce friction — the most common area type (10-minute walk) appeared pre-selected.
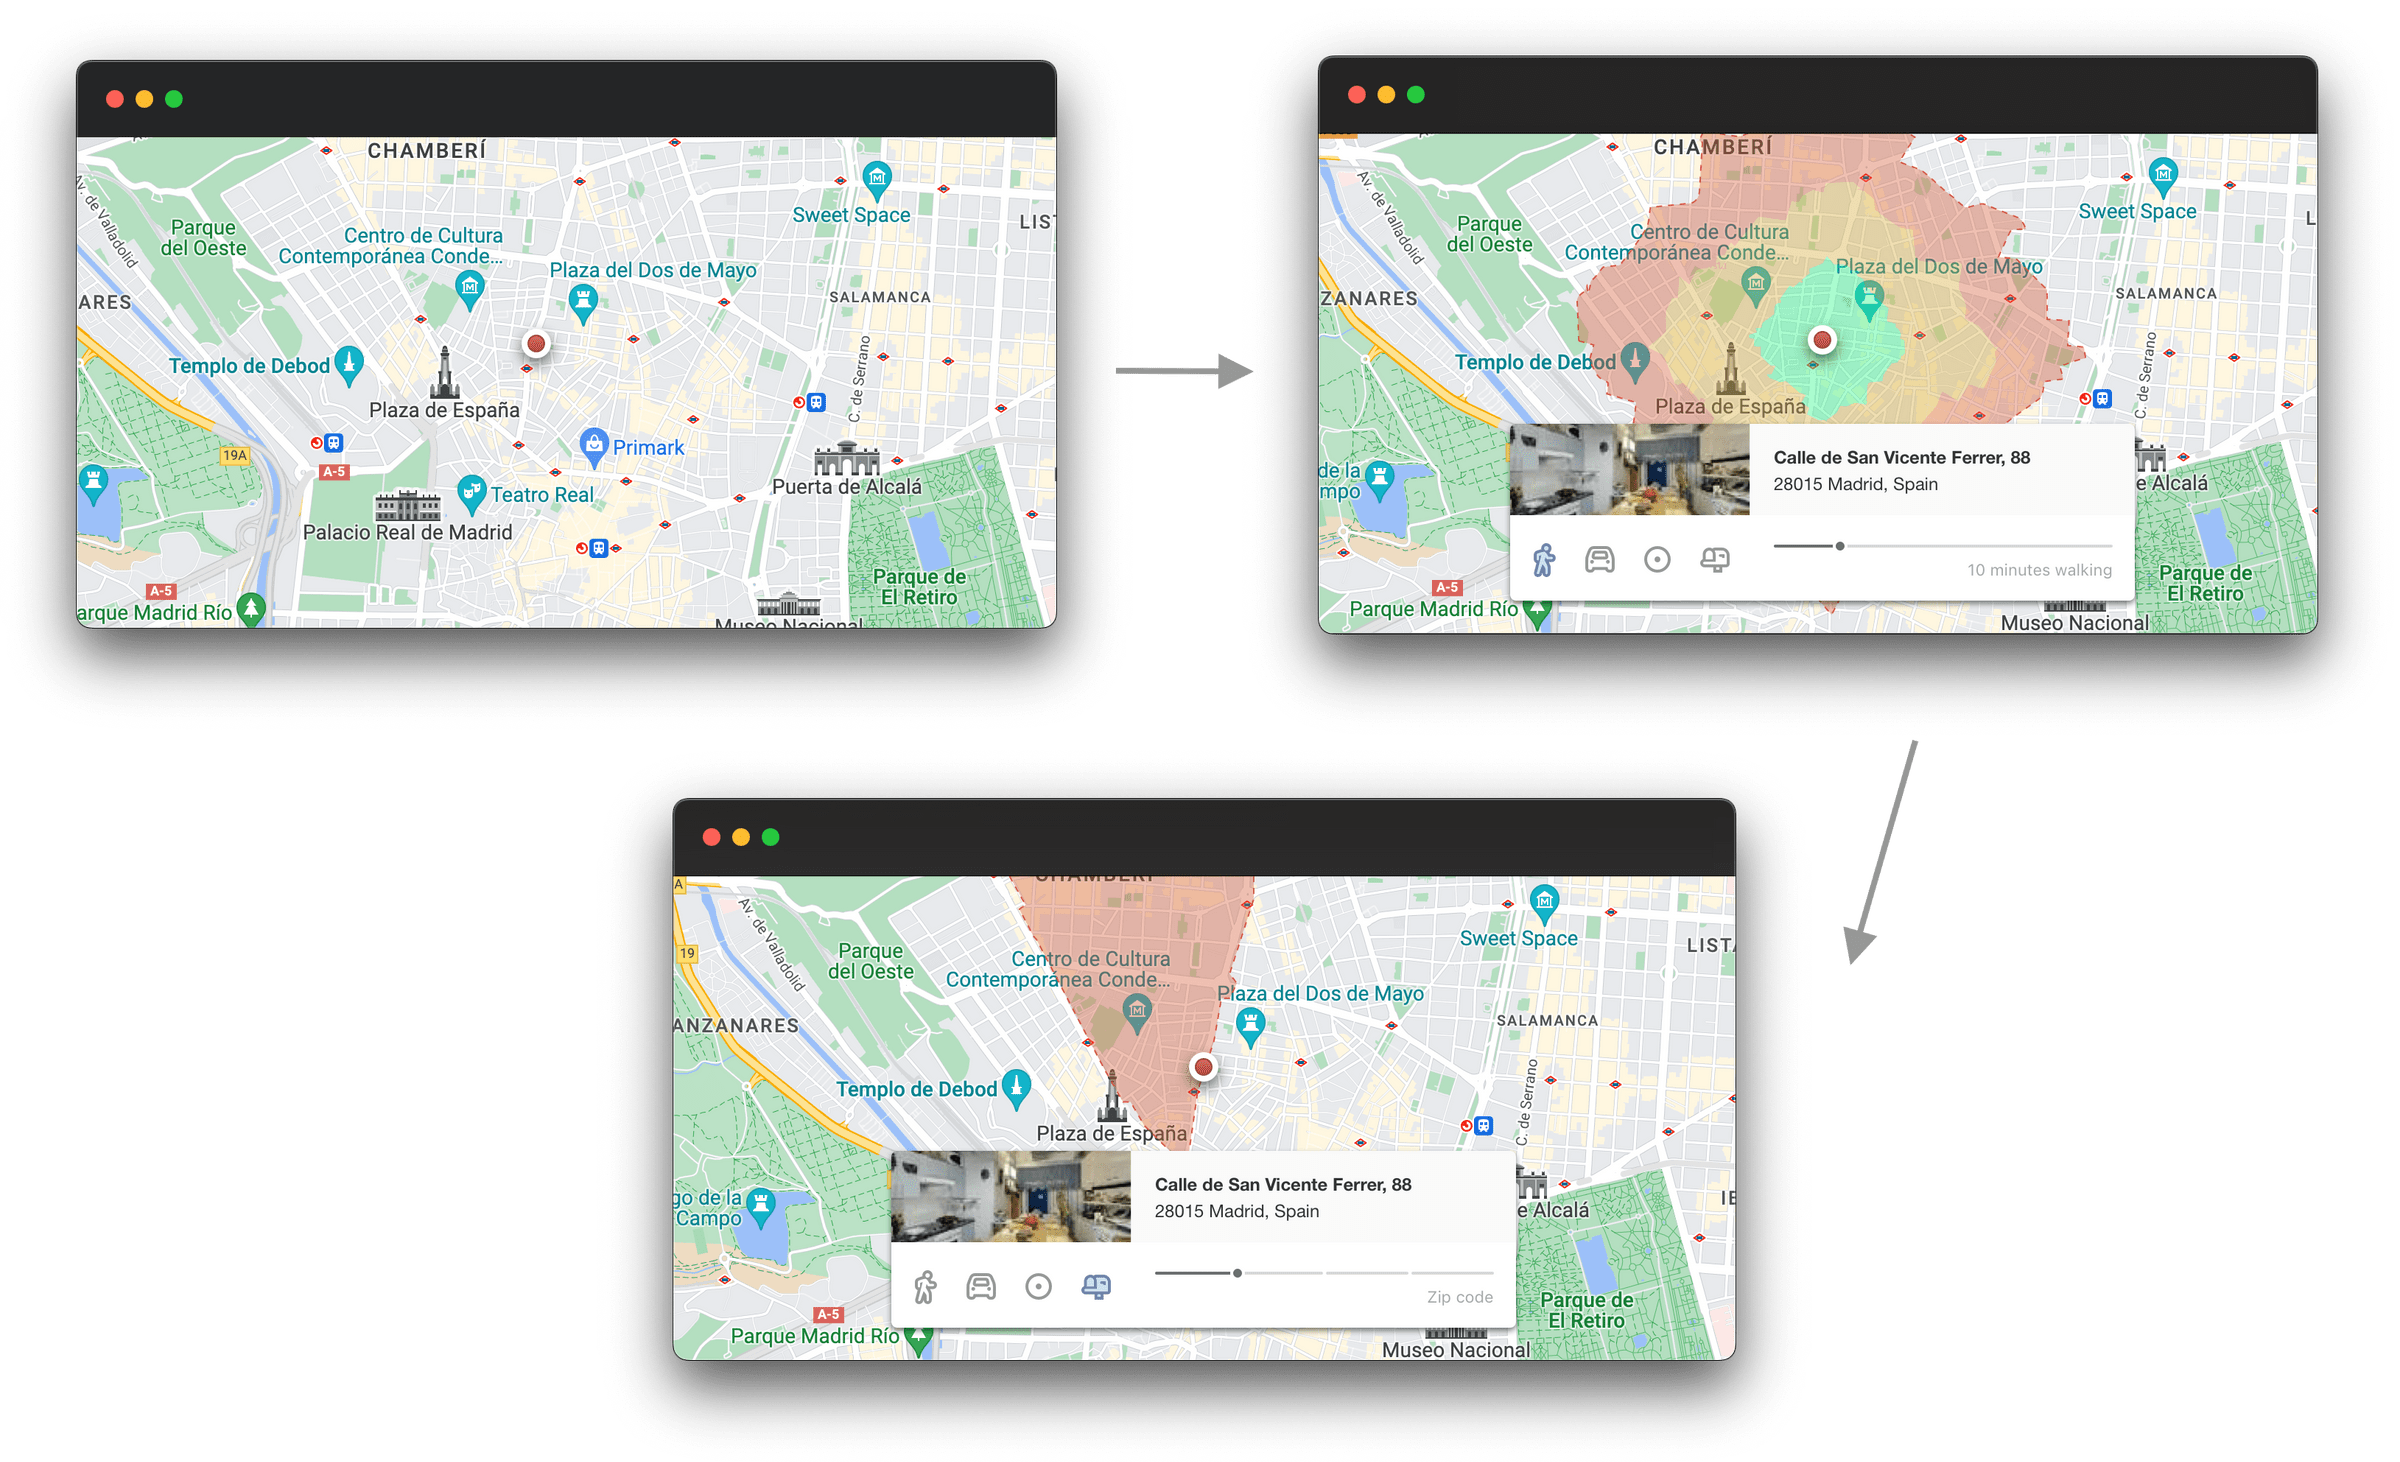
Immediate feedback (zero seconds for the area drawing, two seconds for the report) made every function at each phase in the flow absolutely clear to the user.
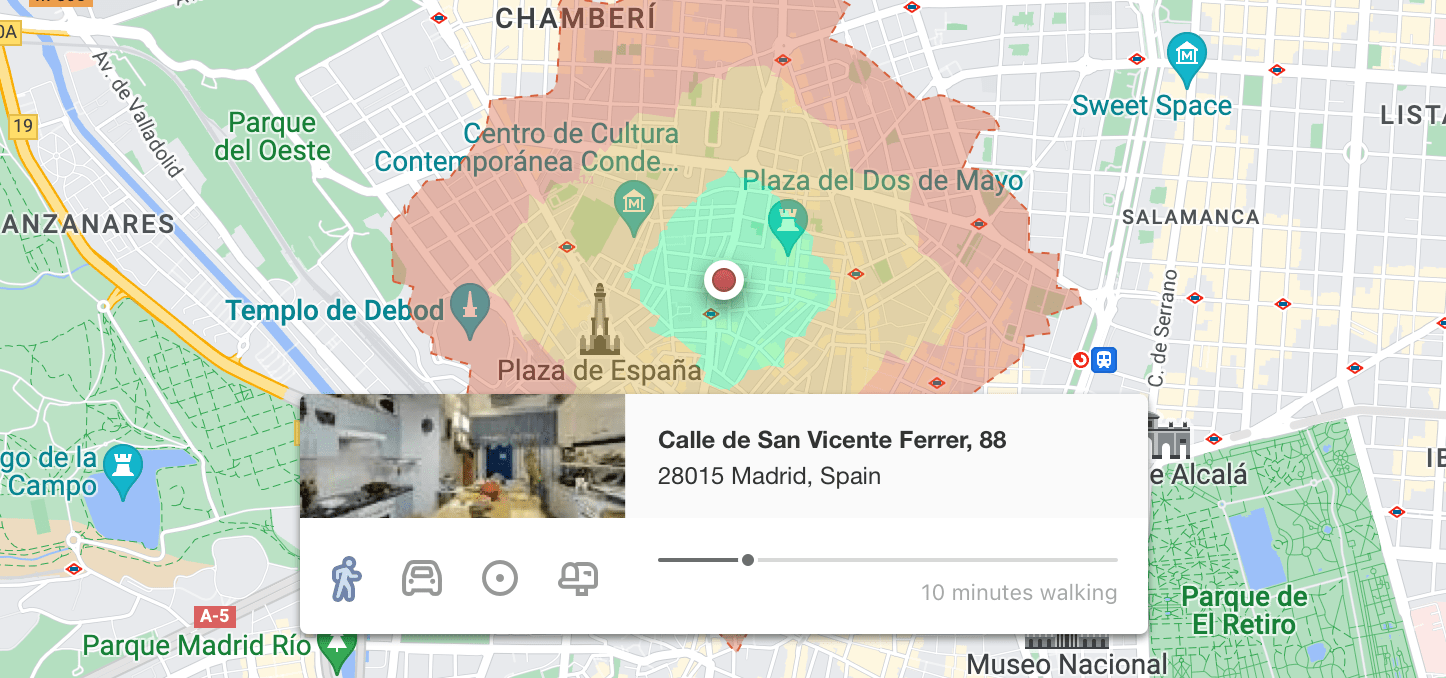
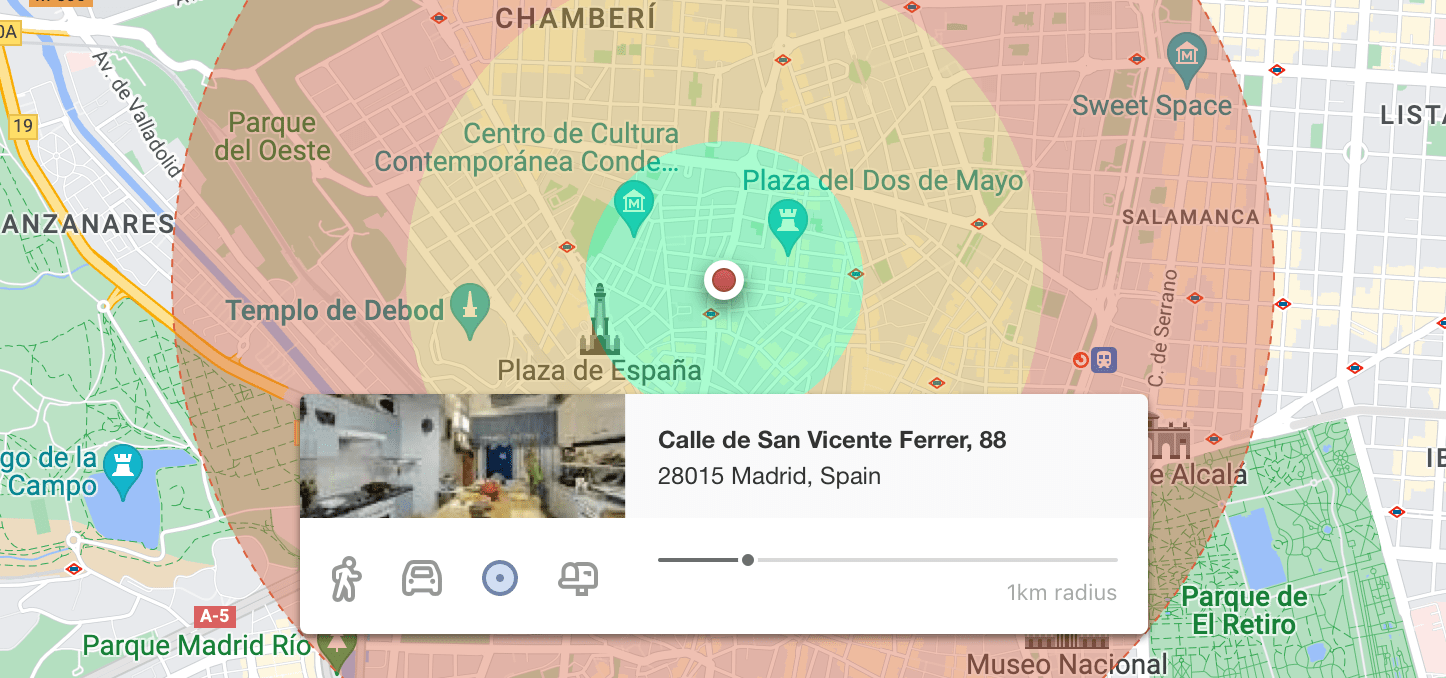
A tooltip system provided contextual help for each area type, supporting users exploring the feature for the first time.
Impact & Legacy
The results were evident from day one. Customers expressly thanked us for the redesign, and metrics showed a substantial increase in catchment area creation — including from users who had previously abandoned the feature.
Specific adoption metrics are not disclosed to respect the private nature of this data.
"With Geoblink people are more comfortable with the database we have and are self-sufficient."Daniel Izquierdo, Business Intelligence Analyst, Danone
"Now every time we are going to make a new opening, we bring a Geoblink report."Andreu Beltran, Marketing Communication Manager, Granier
Beyond the feature itself, this redesign served as a gateway for several subsequent projects. The custom icon set I designed replaced all generic icons across the platform.
The biggest downstream impact was establishing the foundation for a complete frontend redesign following the same principles of reducing friction and optimizing communication. After more than a year of work, this effort culminated in an open-source design system.
The catchment area redesign improved the user experience measurably, solved the core challenge, and contributed directly to the improvement of the entire product in the medium term.